6. Data Processing Part-2: Processing Image (sentinel) data#
6.1. Import Sentinel Image#
In the third chapter, we discussed how to download sentinel image from website. We can use SNAP desktop specially developed by European Satellite Agency(ESA) for the analysis of optical and Radar images. However, we will process sentinel data in Grass GIS. Grass installation does not have the tool to import Sentinel image. However, we can install extension to import. Following code run in console will install the extension.
g.extension i.sentinel
The i.setinel extension allows you to import sentinel image from the directory where the downloaded image is unzipped. I have unzipped the zip file downloaded from sentinel in D:/IOE/landslidehazard/sentinel. To import individual band into the Grass workspace, we use the following code.We need only bands 4, 8 and 11 for current tutorial. However, I have imported bands 2, 3, 4, 8 and 11. First three bands correspond to blue, green and red respectively, which enable you to visualize the image in RGB color. Similarily combination of bands 3, 4 and 8 (NIR) will let you visualize the vegetation intensity.
i.sentinel.import input=D:/IOE/landslidehazard/sentinel pattern=B02_10mi.sentinel.import input=D:/IOE/landslidehazard/sentinel pattern=B03_10mi.sentinel.import input=D:/IOE/landslidehazard/sentinel pattern=B04_10mi.sentinel.import input=D:/IOE/landslidehazard/sentinel pattern=B08_10mi.sentinel.import input=D:/IOE/landslidehazard/sentinel pattern=B11_20m
While importing the image, you may get an error, but you can ignore. The image bands are already imported to Grass.
Tip
Some errors can be removed by using following steps for windows (in new version of numpy, np.float should be replaced by float)
Open C:\Users\your-user-name\AppData\Roaming\GRASS7\addons\scripts\i.sentinel.import.py using some better notepad
replace all the occurrences of np.float to float
6.2. Creating colored image#
Note
For all the calculations listed afterwards, replace the name of bands according the sentinel data you have downloaded
We can create colored image by using d.rgb to display colored image. Before that we use image enhancement as follows:
For natural color image (bands 4, 3, 2):
Color enhancement:
i.colors.enhance red=T45RUL_20221024T044849_B04_10m@NewBasin green=T45RUL_20221024T044849_B03_10m@NewBasin blue=T45RUL_20221024T044849_B02_10m@NewBasin strength=90Color display:
d.rgb red=T45RUL_20221024T044849_B04_10m@NewBasin green=T45RUL_20221024T044849_B03_10m@NewBasin blue=T45RUL_20221024T044849_B02_10m@NewBasin
False color image(nir-red-green: 8, 4 3):
We can use the same method as above by just replacing band-8 to band-4 and show on. The images visualized in true color (bands 4, 3, 2) and false color (8, 4, 3) are shown below.
6.3. Sentinel Image processing#
Now let us create two other parameters which we will use for susceptibility analysis. They are NDVI (Normalized Difference Vegetation Index) and NDWI (Normalized Difference Water Index). They are given by the following equations.
and
6.3.1. NDVI#
In case of Sentinel Red is represented by band-4 and NIR (Near Infrared) is represented by band-8. We can use mapcalc which is used for various raster calculations. However, the standard indices can be calculated by using i.vi tool which can provide calculation of more than 20 indices. By running i.vi and checking the manual one can find the list of indices.
6.3.2. NDWI#
In case of sentinel, it is recommended to use Band-11 and Band-8 to calculate this index. We will use following codes to calculate the two indices.
Use following code to calculate NDVI:
i.vi output=ndvi viname=ndvi red=T45RUL_20200311T045659_B04_10m nir=T45RUL_20200311T045659_B08_10m
Use following code to calculate NDWI:
r.mapcalc 'ndwi = float(T45RUL_20200311T045659_B08_10m - T45RUL_20200311T045659_B11_20m)/ (T45RUL_20200311T045659_B08_10m +T45RUL_20200311T045659_B11_20m)'
6.3.3. Outputs of NDVI and NDWI#
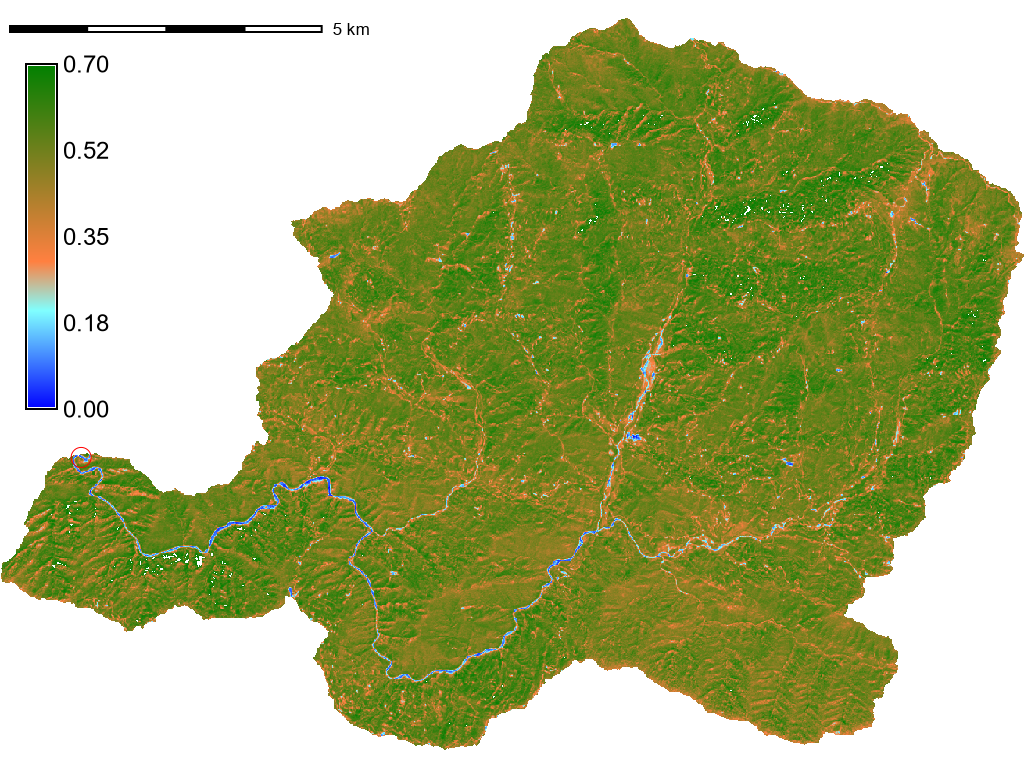
Fig. 6.1 NDVI Image#
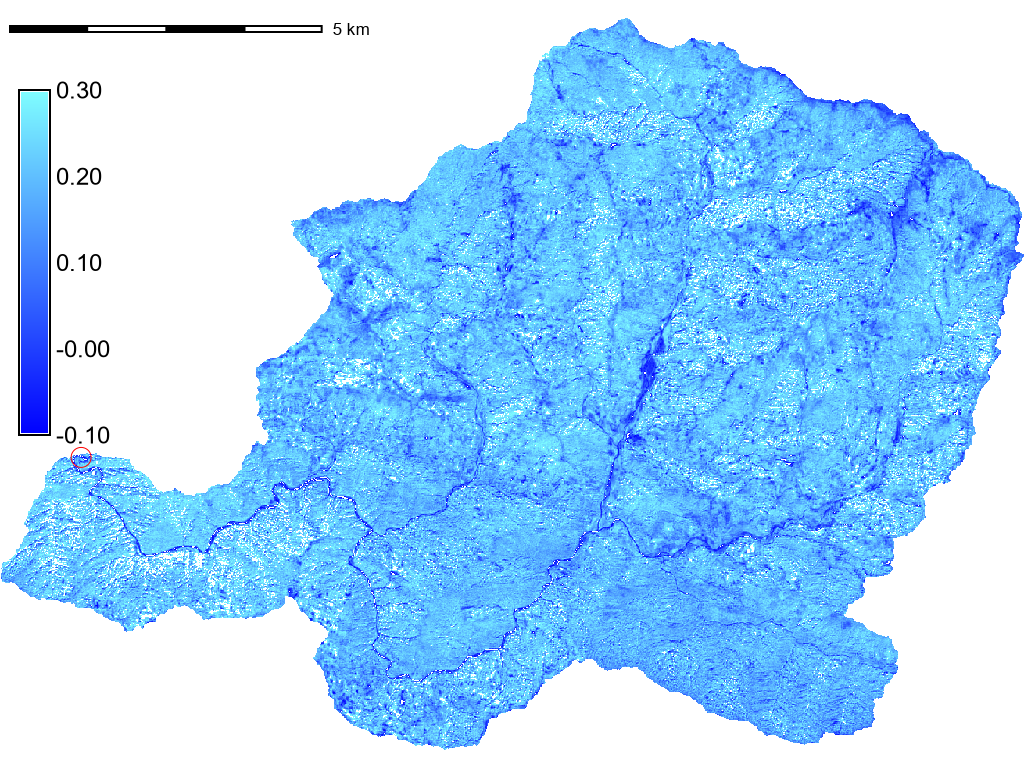
Fig. 6.2 NDWI Image#