5. Data Processing Part-1: Processing Elevation Data#
We will process the elevation data as mentioned in the following steps:
Create watershed basins and river network for the region.
Select an outlet point and create a watershed for that outlet point.
The newly created watershed area will be our new region for susceptibility analysis.
Create terrain variables for the region.
5.1. Hydrological analysis#
Elevation data is enough to create watershed boundaries and river network. In this tutorial, we will not talk about theory behind it but just create them.
5.2. Create basins and stream networks#
Following steps explain how to create watershed boundaries in Grass.
Click Menu Raster \(\rightarrow\) Hydrologic Modeling \(\rightarrow\) Watershed Analysis as shown in the next figure. Alternatively you can write a command r.watershed in the console and press enter key. In the next dialog, select Inputs tab and set dem_rect as elevation data. Keep other fields empty. In the Outputs tab enter only the required output maps as shown in the figure. Alternatively, you can write the following code in the console and press enter to run.
r.watershed elevation=dem_rect@PERMANENT threshold=15000 accumulation=floacc drainage=flodir basin=basin stream=stream
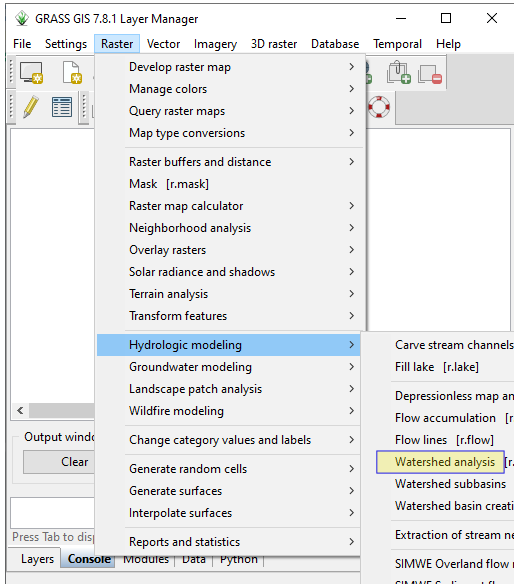
Fig. 5.1 Create Watersheds#
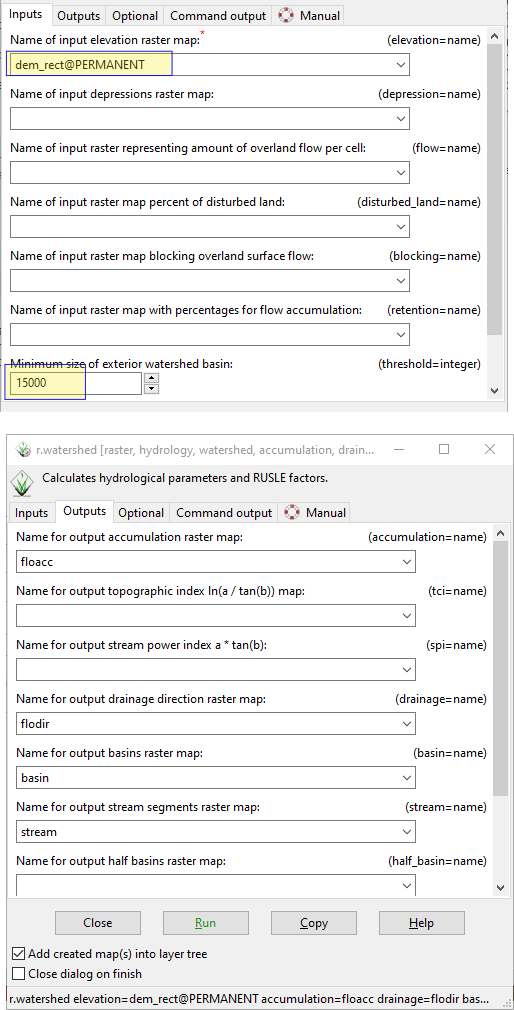
Fig. 5.2 Create Watersheds#
Value of threshold decides the minimum size of basins to be created. Now we can create the stream raster and vector using the following code.
r.stream.extract elevation=dem_rect@PERMANENT accumulation=floacc@PERMANENT threshold=5000 stream_raster=stream_2 stream_vector=river direction=flodir --overwrite
To check the meaning of each input and output, write r.stream.extract in the console and press enter. Corresponding dialog has a tab named Manual which explains the working of the tool and the meaning of parameters in detail.
We can show or hide a layer in the map using Layer Manager interface. The image of elevation with stream looks as in the following figure.
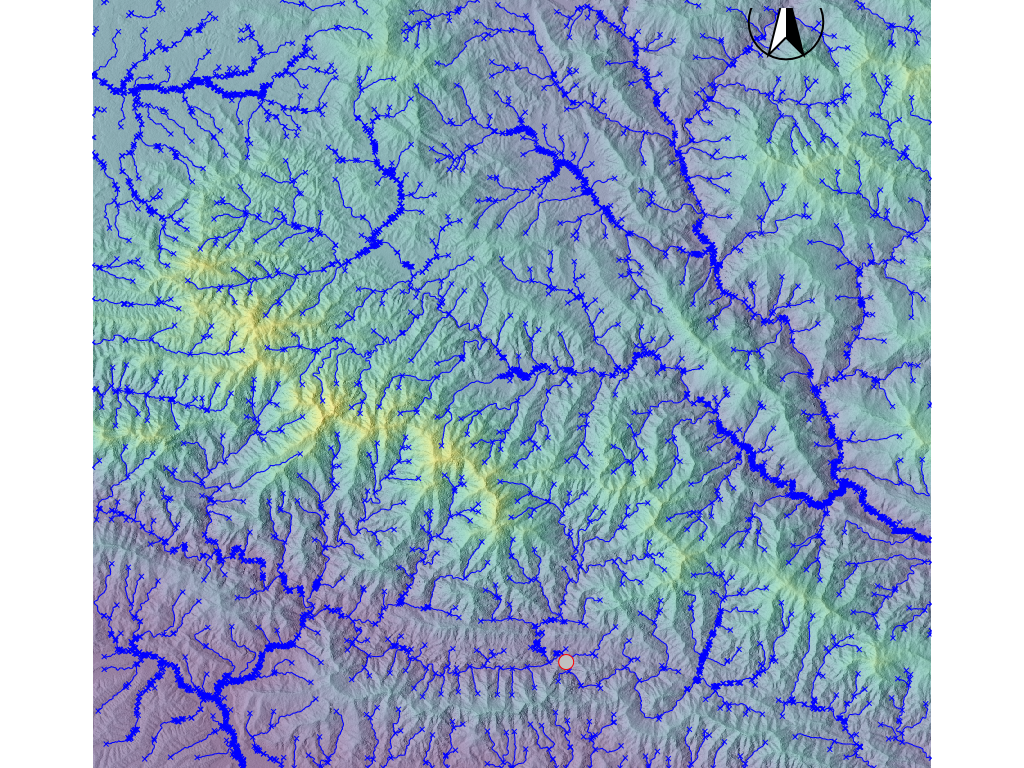
Fig. 5.3 Image of Stream Network#
The watershed area of the Roshi river can be created by using the following code (coordinates are retrieved by right-clicking at the outlet of Roshi river basin and then copying the coordinates..
r.water.outlet input=flodir@PERMANENT output=ws_roshi coordinates=381203.03159320896,3035645.774288979
The vector polygon showing the watershed as polygon was created using the following code.
r.to.vect input=ws_roshi@PERMANENT output=roshiws type=area
We can print the area of the watershed using the following command.
v.to.db -p roshiws option=area type=boundary units=k
cat |
area |
|---|---|
1 |
545.95375 |
5.3. Create new region (Using an outlet point)#
The area of roshi watershed (545 \(km^2\)) is quite large. Therefore, we will create a smaller watershed to reduce the analysis time. For this, we will use a new outlet point which is shown in the above figure by red-circle. To create a new region, follow the steps below.
Click Query Raster/Vector map(s) tool in the Map window.
Click a junction of river.
A dialog box will show the coordinates of clicked coordinates. Copy the coordinates with a right-click. In the next step we will create the watershed boundary at the selected outlet point.
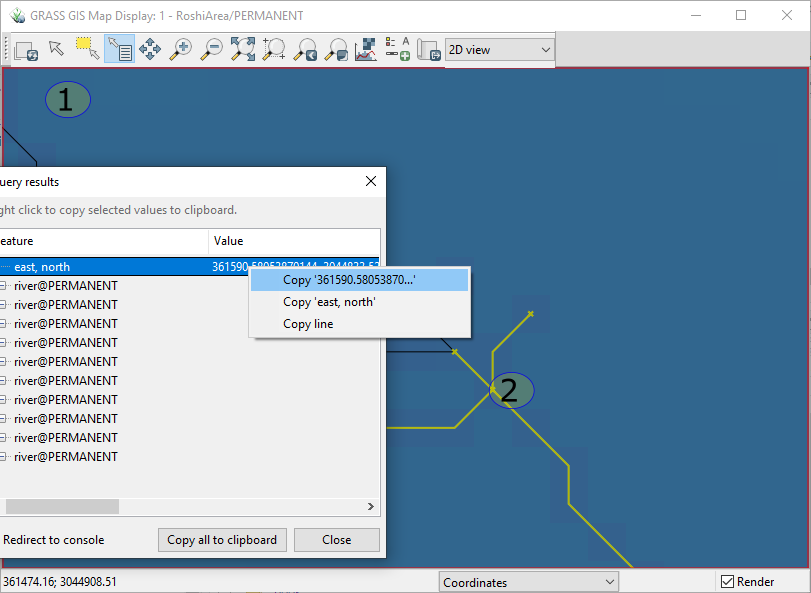
Fig. 5.4 Select the Outlet Coordinates#
Write the following code and run in the console.
r.water.outlet input=flodir@PERMANENT output=ws_new coordinates=365454.7136,3025711.9763
Above code uses flow direction map as input and outputs new watershed as raster. The coordinates of output are copied from the last step. The raster output ws_new is our new region. To set a new region, we need to:
Convert the output to vector map using
r.to.vect input=ws_new@PERMANENT output=basin type=area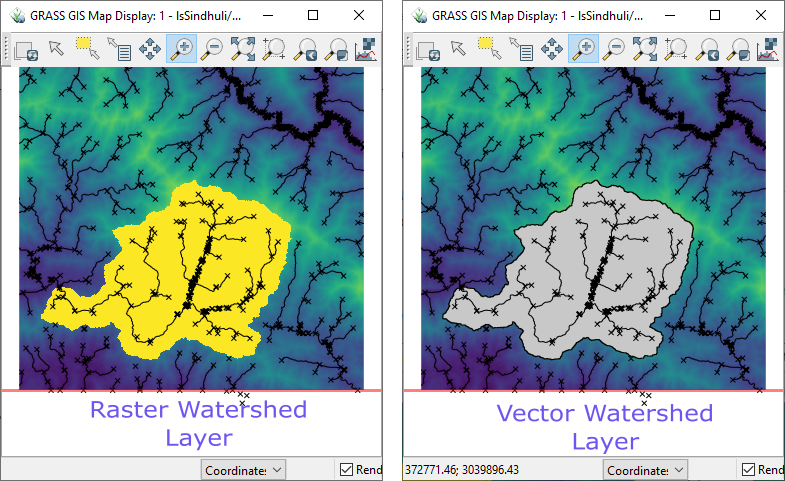
Fig. 5.5 Convert Watershed Raster to Vector Polygon#
Crop the region to the extent of basin.
Enter following codes and run each in sequence.
r.mask vector=basinr.mapcalc "dem_clip = dem_rect"(Note: there should be space before and after = in the second code)
First code will create a mask which will be used to set region for the subsequent calculation. Second code will create a copy of the original DEM (elevation map), however only to the extent of mask.
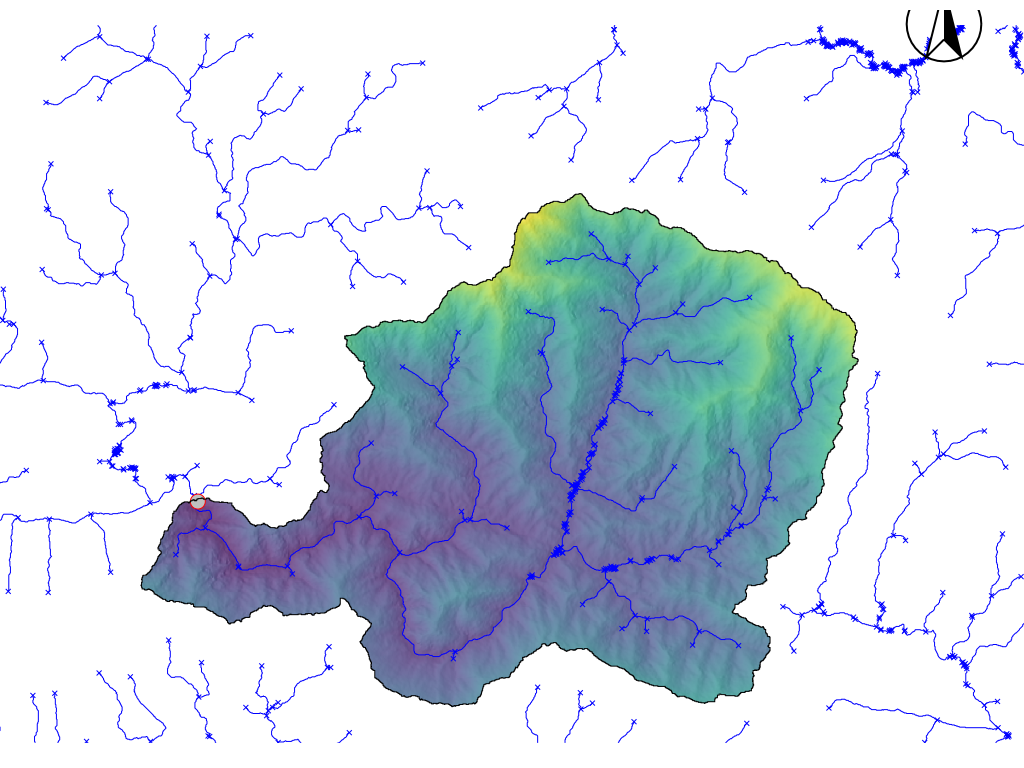
Fig. 5.6 Clip the Elevation Data to Watershed Boundary#
5.4. Adding Mapset#
Grass-GIS creates a Mapset with default name of PERMANENT. However, we can create new mapsets as required. Let us create a mapset called NewBasin. We will do all the subsequent processes in the new mapset.
g.mapsets mapset=NewBasin operation=add
Now display the new mapset using menu: File \(\rightarrow\) Map display \(\rightarrow\) New map display window.
We need to change the region for the mapset using the following code.
g.region vector=basin
Add the mask for the new mapset.
r.mask vector=basin
Display the raster dem-clip and vector basin in the new display and using the Zoom to computational window extent in the map display window.
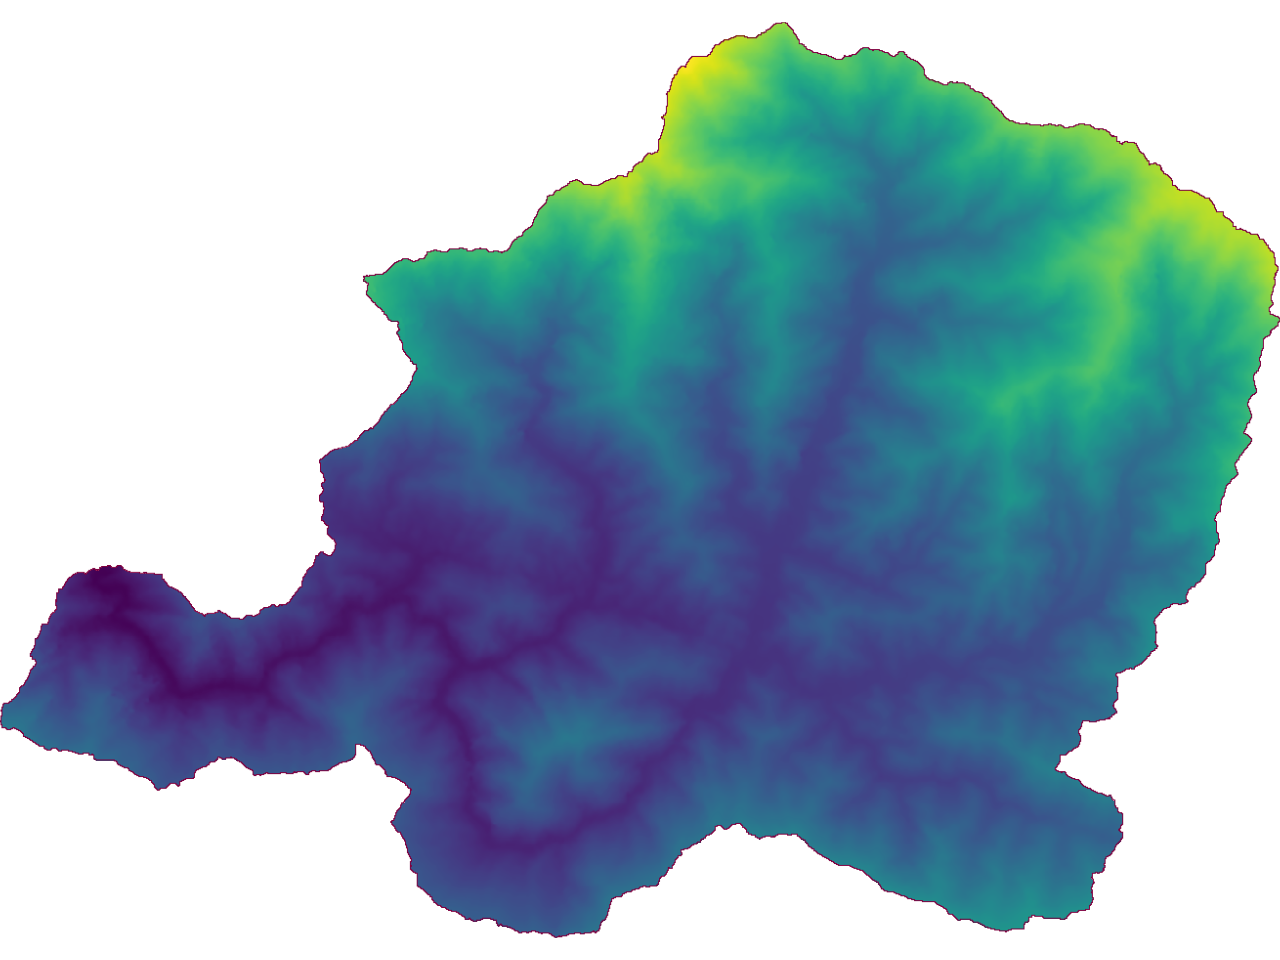
Fig. 5.7 Display of New Basin Mapset#
5.5. Create slope, aspect, plan and profile curvature#
There are various ways to run various tools in Grass GIS. To create slope, aspect maps, we can do either of the following two methods:
At the bottom of layer manager select console tab and write r.slope.aspect and Enter key. You may have to press Enter key two times. Or
Click Menu Raster -> Terrain Analysis -> Slope and aspect as shown in the next figure.
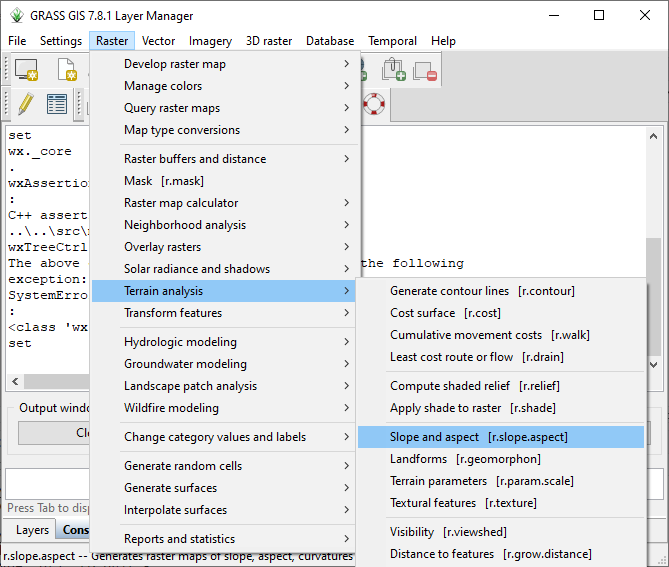
Fig. 5.8 Create Terrain Variables#
We can create various terrain variables using this tool. We need to enter the input elevation map and output terrain variables.
In the screen, select Required tab and select input as dem_clip from the drop down menu.
Write the names of output map by selecting Outputs tab as shown in the next figure.
Click Run button at the bottom of interface.
Alternatively (instead of the above steps), you can directly run following code from console (Recommended):
r.slope.aspect elevation=dem_clip@PERMANENT slope=slope aspect=aspect pcurvature=profcurv tcurvature=tancurv
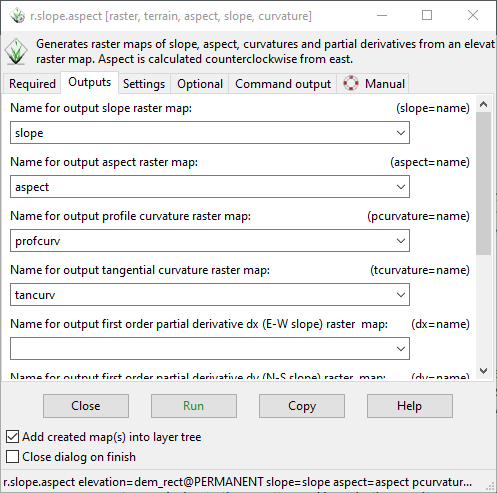
Fig. 5.9 Create Slope Aspect from Console#
An example of the output of the slope-aspect calculation is shown below (Aspect layer transparency is 50% and its displayed above the slope layer)
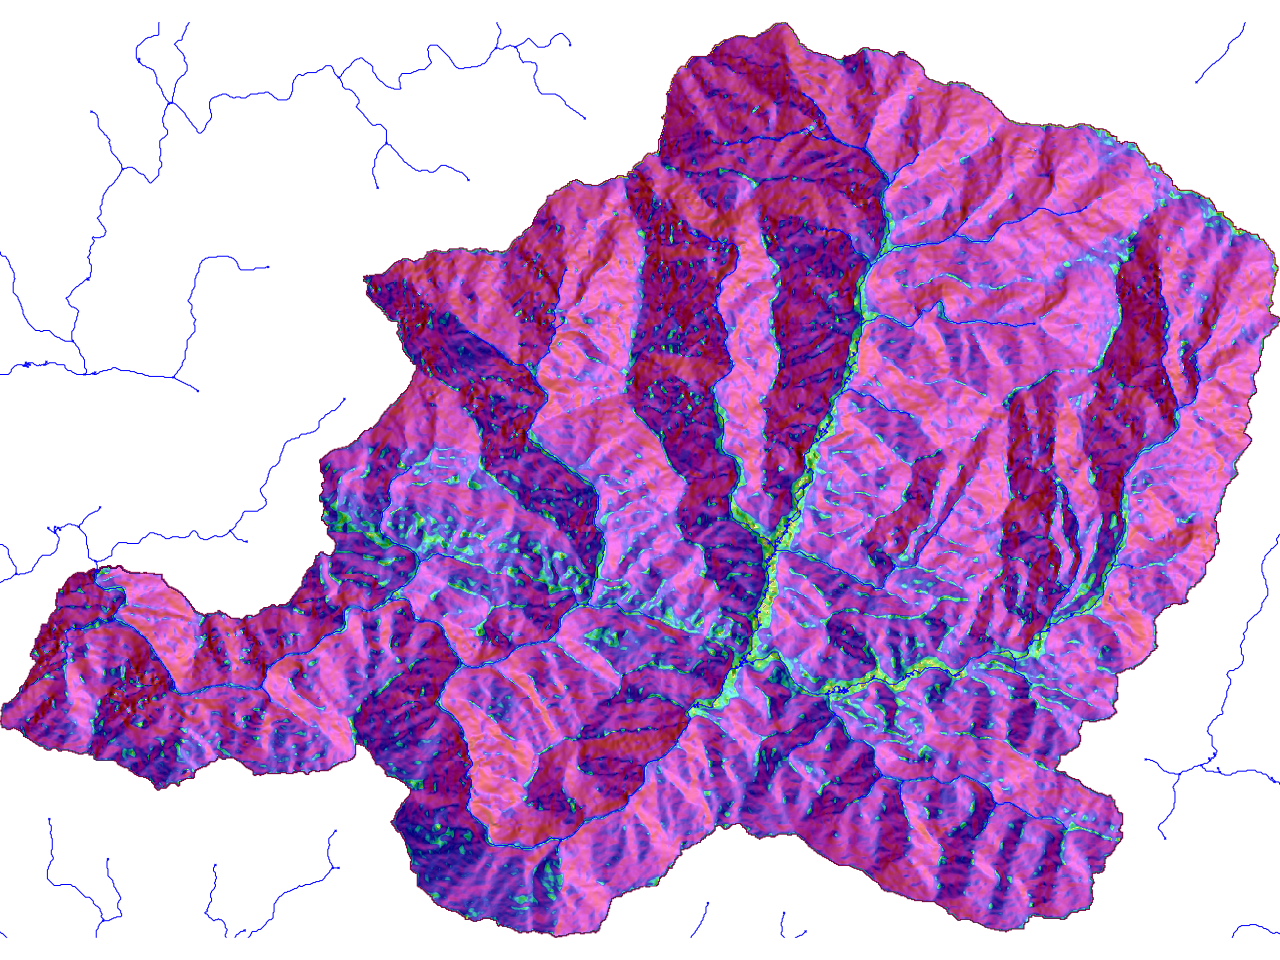
Fig. 5.10 Example of Slope Aspect#
5.6. River distance Map#
Distance to river can be output as raster map using following code.
r.grow.distance input=stream_2 distance=riverdist
It will create a raster, each cell of which represents the distance from nearest stream.

Fig. 5.11 River Distance Raster#