Chapter 8 Data Processing Part-3: Classify raster datasets
We need to classify raster datasets in different categories. For example, slope can be classified into 10 degrees intervals. Grass GIS uses rules file for classifying raster data.
8.1 Classify Slope raster
To classify sloper raster, create a text data file in a notepad or other text editor such notepad++ and copy the following text.
0:15:1:1
15:30:2:2
30:45:3:3
45:60:4:4
60:75:5:5
75:90:6:6
The above rule means that orginal slope values from 0 to 15 will be replaced by 1 in the output map and so on. Save the file as slopecl.txt. Run the following code in the console.
r.recode input=slope@PERMANENT output=slopecl rules=path/to/slopecl.txt
It will produce a reclassified map of slope with values ranging from 1 to 6. Following figure shows the reclassified slope map.
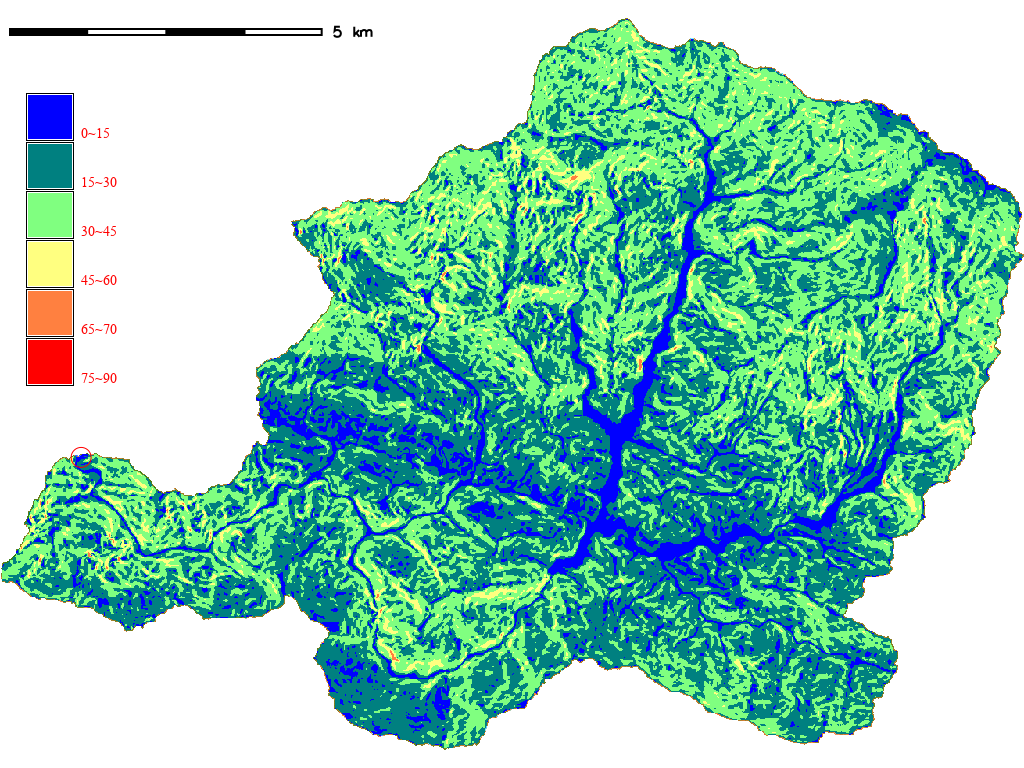
Figure 8.1: Reclassified Slope map
8.2 Classify aspect data
We generally use 4 or 8 directions. In this exercise, we will use 8 directions; North, North-East, East, South-East, South, South-West, West and North-West. As the aspect map has values ranging from 0 to 360, we use following rules.txt file for classification. 0 aspect represents flat cell.
0:0:0:0
0.0001:22.5:1:1
22.5:67.5:2:2
67.5:112.5:3:3
112.5:157.5:4:4
157.5:202.5:5:5
202.5:247.5:6:6
247.5:292.5:7:7
292.5:337.5:8:8
337.5:360:1:1

Figure 8.2: Reclassified Aspect map
8.3 Classify NDVI
NDVI values range from -1 to 1. The values below 0 generally represent water bodies. As such, following classification rule was created.
-1:0:1:1
0.0001:0.1:2:2
0.1:0.2:3:3
0.2:0.3:4:4
0.3:0.4:5:5
0.4:0.5:6:6
0.5:0.6:7:7
0.6:0.7:8:8
0.7:1.0:9:9

Figure 8.3: Reclassified NDVI map
8.4 Classify NDWI
NDWI values range can be obtained by running code r.info map=ndwi@PERMANENT. In my case the information shows: Range of data: min = -0.4883721 max = 0.5444221. It may be different for other areas. Following classification rule was created to classify NDWI.
-0.6:-0.4:1:1
-0.4:-0.2:2:2
-0.2:0.0:3:3
0.0:0.2:4:4
0.2:0.4:5:5
0.4:0.6:6:6

Figure 8.4: Reclassified NDWI map
8.5 Classify Profile Curvature
- Range of Data: min = -0.1029236 max = 0.09147612
- Classification rules:
-0.1:-0.05:1:1
-0.05:-0.01:2:2
-0.01:0.0:3:3
-0.0:0.01:4:4
0.01:0.05:5:5
0.05:0.1:6:6
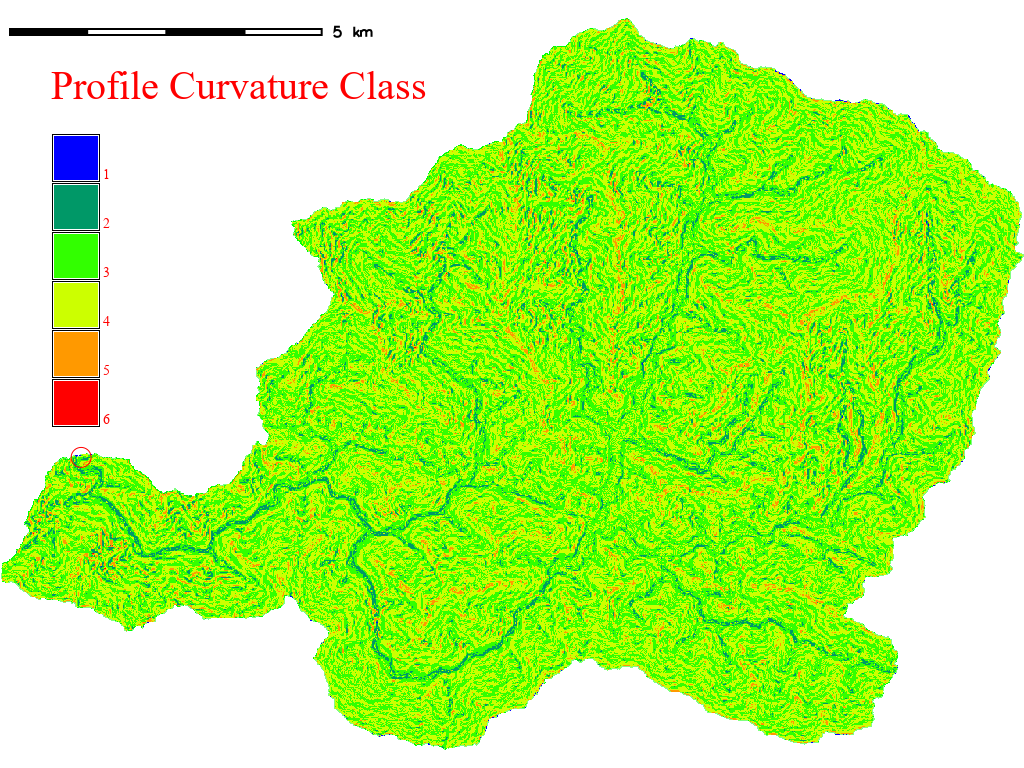
Figure 8.5: Reclassified NDWI map
8.6 Classify Tangent Curvature
- Range of Data: min = -0.1612968 max = 0.09415767
- Classification rules:
-0.2:-0.05:1:1
-0.05:-0.01:2:2
-0.01:0.0:3:3
-0.0:0.01:4:4
0.01:0.05:5:5
0.05:0.1:6:6
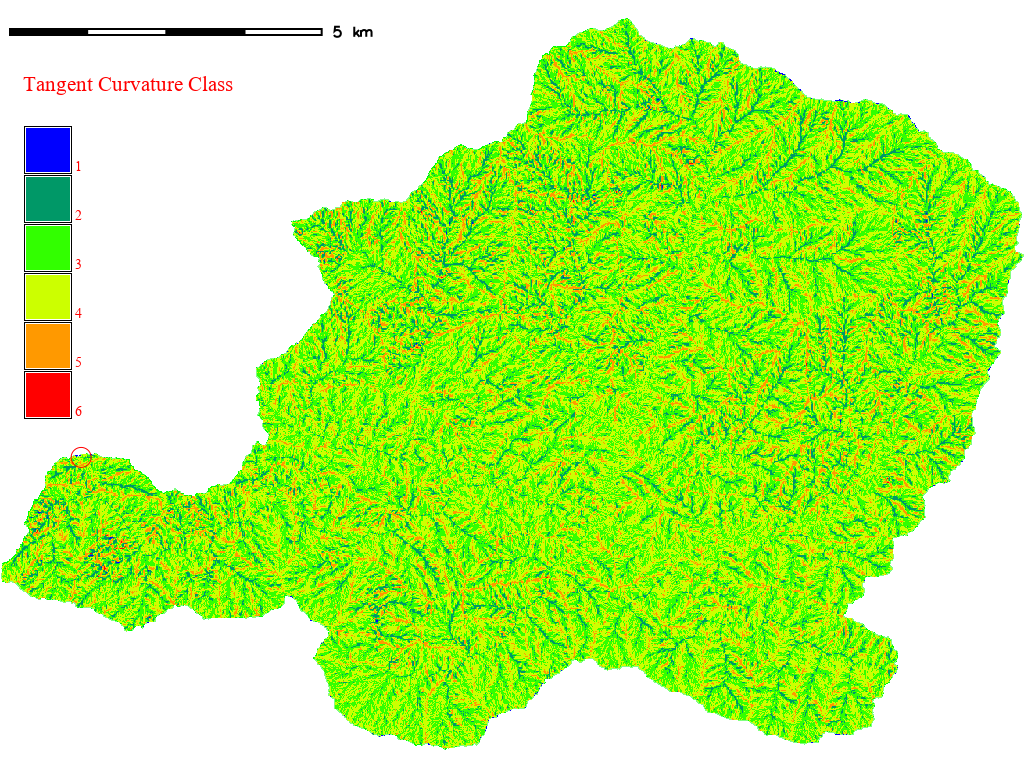
Figure 8.6: Reclassified NDWI map
8.7 Classify River Distance Raster
- Range of Data: min = 0 max = 7108.54459435966
- Classification rules:
0:100:1:1
100:200:2:2
200:500:3:3
500:1000:4:4
1000:2000:5:5
2000:8000:6:6

Figure 8.7: Reclassified River Distance map