Chapter 7 Data Processing Part-2: Processing Image (sentinel) data
7.1 Import Sentinel Image
In the third chapter, we discussed how to download sentinel image from website. We can use SNAP desktop specially developed by European Satellite Agency(ESA) for the analysis of optical and Radar images. However, we will process sentinel data in Grass GIS. Grass installation does not have the tool to import Sentinel image. However, we can install extension to import. Following code run in console will install the extension.
g.extension i.sentinel
The i.setinel extension allows you to import sentinel image from the directory where the downloaded image is unzipped. I have unzipped the zip file downloaded from sentinel in
i.sentinel.import input=D:/IOE/landslidehazard/sentinel pattern=B02_10mi.sentinel.import input=D:/IOE/landslidehazard/sentinel pattern=B03_10mi.sentinel.import input=D:/IOE/landslidehazard/sentinel pattern=B04_10mi.sentinel.import input=D:/IOE/landslidehazard/sentinel pattern=B08_10mi.sentinel.import input=D:/IOE/landslidehazard/sentinel pattern=B11_20m
While importing the image, you may get an error, but you can ignore. The image bands are already imported to Grass.
The images visualized in true color (bands 4, 3, 2) and false color (8, 4, 3) are shown below.
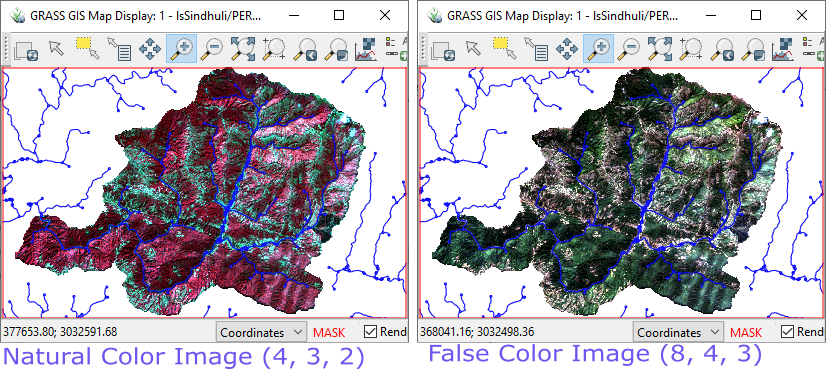
Figure 7.1: Natural and False Color
7.2 Sentinel Image processing
Now let us create two other parameters which we will use for susceptibility analysis. They are NDVI (Normalized Difference Vegetation Index) and NDWI (Normalized Difference Water Index). They are given by the following equations.
\(NDVI=\frac{NIR - Red}{NIR + Red}\)
\(NDWI = \frac{NIR-Green}{NIR+Green}\)
7.2.1 NDVI
In case of Sentinel Red is represented by band-4 and NIR (Near Infrared) is represented by band-8. We can use mapcalc which is used for various raster calculations. However, the standard indices can be calculated by using i.vi tool which can provide calculation of more than 20 indices. By running i.vi and checking the manual one can find the list of indices.
7.2.2 NDWI
In case of sentinel, it is recommended to use Band-11 and Band-8 to calculate this index. We will use following codes to calculate the two indices.
- Use following code to calculate NDVI:
i.vi output=ndvi viname=ndvi red=T45RUL_20200311T045659_B04_10m nir=T45RUL_20200311T045659_B08_10m
- Use following code to calculate NDWI:
r.mapcalc ‘ndwi = float(T45RUL_20200311T045659_B08_10m - T45RUL_20200311T045659_B11_20m)/ (T45RUL_20200311T045659_B08_10m +T45RUL_20200311T045659_B11_20m)’
7.2.3 Outputs of NDVI and NDWI
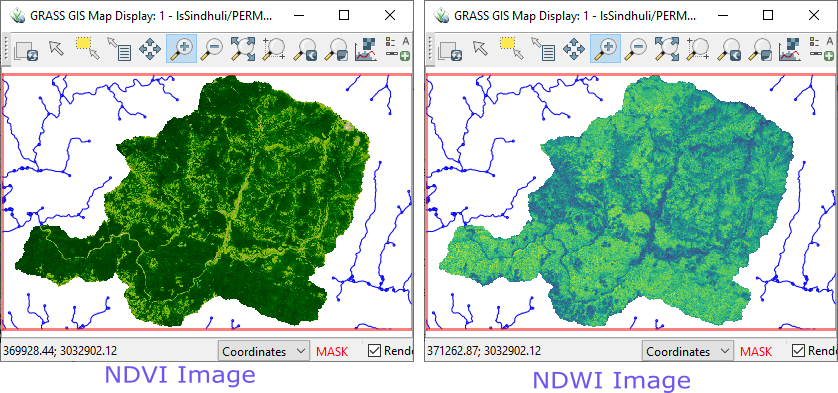
Figure 7.2: NDVI and NDWI images