2 Analysis of River channel and basin using QGIS and Grass-GIS
2.1 Background and content
This tutorial is prepared for learning river channel delineation and watershed basin generation from Elevation data. Elevation clipped to the boundary of a mountainous district of Nepal is used for this practice. ASTER DEM is a freely available elevation data which is used in this analysis. Following part is skipped in this tutorial.
- Downloading ASTER DEM data intersecting the area of a district.
- Merging the multiple elevation data (DEM raster)
- Clipping to the boundary of a district.
- Transforming the CRS to UTM projection.
2.2 Analysis method
Following methods will be explained using QGIS and Grass-GIS separately.
- Creating river channel and river (drainage) basin
- Creating pour point (outlet) based watershed boundary
2.3 Analysis using QGIS
2.3.1 Creating sink-filled DEM data
- In the processing toolbox search for fill sink.
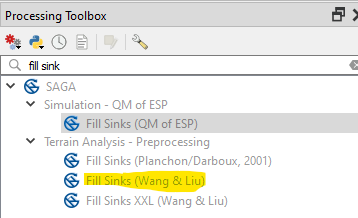
- Select the file names for each output in the dialog box and run.

Flow direction, Basin and filled sink DEM are created as raster data.
2.3.2 Creating river channel and basins as vector data
- Search for channel in the processing toolbox.

- Now run the tool after providing the parameters. In this case, the input DEM should be the sink filled DEM. You should note that SAGA uses sdat extension for raster data and shp (ESRI shapefiles) for vector data as default. Therefore we will use default file types for the output. This tool will produce various intermediate outputs as raster and vector data.

- Let us check the output files (By hiding layers one by one)

2.4 Create watershed for a given watershed basin
- Copy the coordinates of a river junction (node)- 1) select node in the layer 2) click identify tool, 3) select one node, 4) copy feature and 5) paste to a text editor for future use.
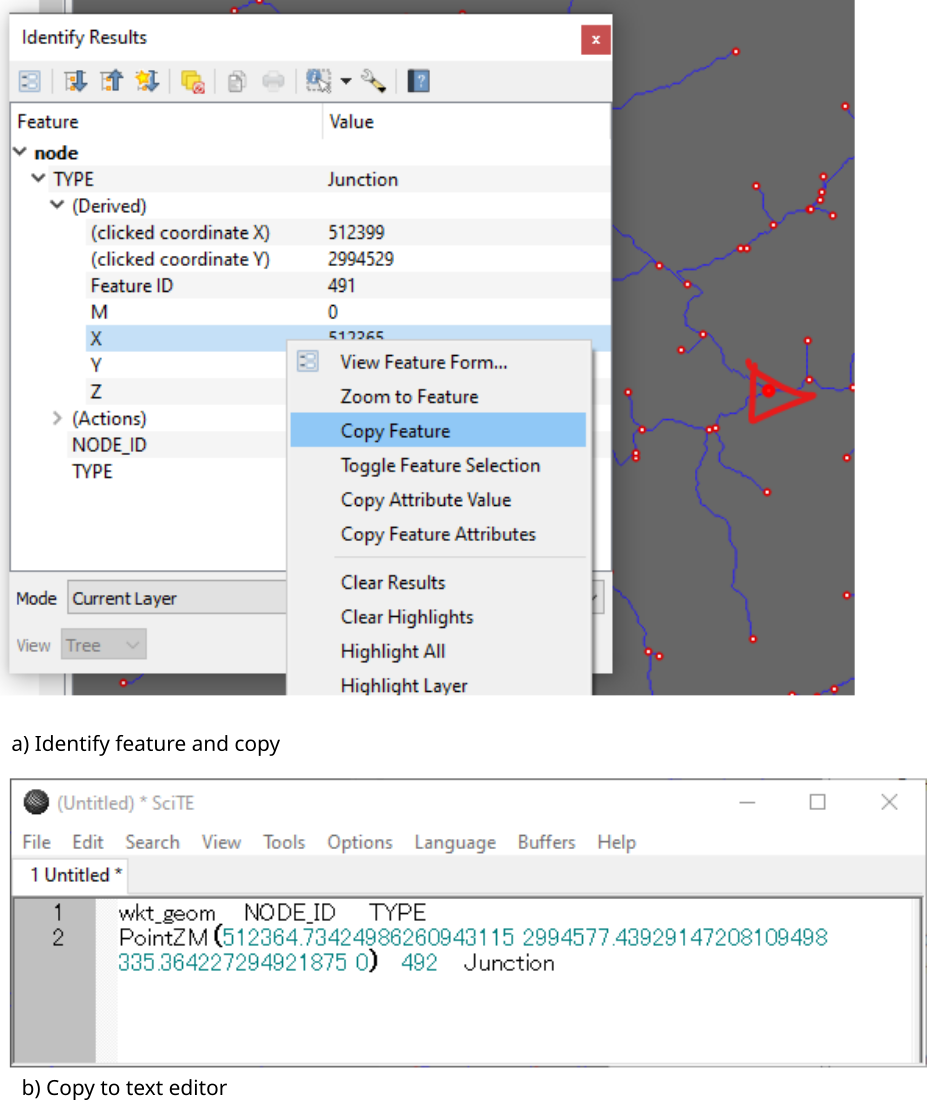
- Search Upslope in the processing toolbox and run with following parameters. The x and y coordinates are copied from the earlier step.


2.5 Analysis using Grass-GIS
First of all create location (Visit this site to check how-to-do) and import DEM raster (It is not necessary to fill sink, you can import UTM-projected, non-sink-filled DEM)
Run the following code in Grass-GIS console
r.watershed DEM threshold=15000 accumulation=floacc drainage=flodir basin=basin
Where DEM is the name of raster map of DEM. Parameters of r.watershed is explained below (Please confirm with the manual of r.watershed)
- accumulation is the flow-accumulation (Number of cells from which water is draining to the particular cell)
- drainage is the direction of drainage
- threshold is the number of cells below which basin is not created
- basin is the output basin raster map.