9 Concept of hydrology analysis in GIS
This exercise introduces you to the concept of hydrology analysis in QGIS. We will use the following data for the exercise. This is very small raster DEM data with 6 rows and 5 columns.
9.1 How the data was created
The data was created using a text editor with following values and saved as ESRI ascii file which can be opened in QGIS. The data doesn’t have any coordinate reference system (CRS) as the ESRI ascii format does not support it. In the next step we will convert it into GeoTIFF (format).
ncols 5
nrows 6
xllcorner 378923
yllcorner 4072345
cellsize 100
nodata_value -9999
480 500 490 480 485
505 495 490 475 480
500 485 455 470 475
495 490 480 465 470
490 485 475 455 450
500 490 480 460 445
9.2 Converting ESRI ascii format to GeoTIFF
- Open OSGeo4wShell and run the following command.
gdal_translate dem.asc rast01.tif -a_srs EPSG:326459.3 Convert the DEM to point data
It is only for display. Use processing tools $r.to.vect. In the dialog box, set feature type to point. Point data will be created. If you display the label it will look as shown.

9.4 Concept of sink
When a cell or a group of cell is at lower elevation than their surrounding cell these cells are called sink cells. In the above figure we can see that the cell-C3 (Named as in Excel) has lower elevation compared to all its surrounding cells.
In the hydrology analysis, the first step is to fill the sink so that the water flows out of the cell.
Let us try two different methods.
- Run
r.fill.dirfrom Processing Toolbox. This Grass-GIS implementation of sink fill. - Run SAGA \(\Rightarrow\) Terrain Analysis - Preprocessing \(\Rightarrow\) Fill Sink (Wang & Liu) (Note: you can find this tool just by searching the term fill sink in the processing toolbox)
- Save all the files as shown below
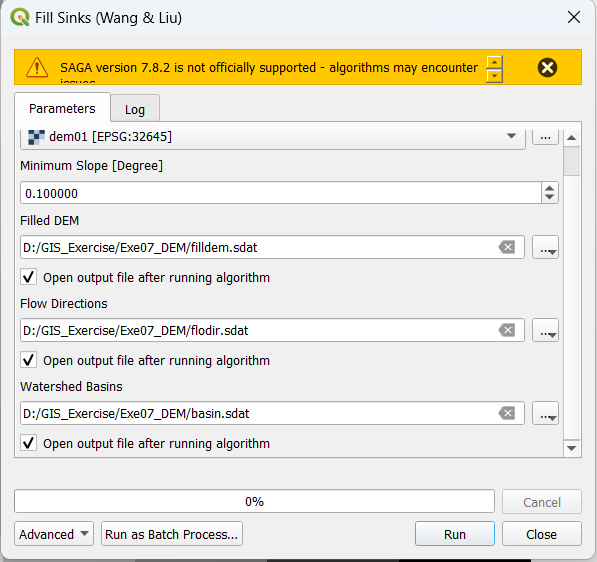
- Save all the files as shown below
The result of above two methods is shown below
 We can see that grass tool replaces the elevation of sink cell to the lowest elevation of the surrounding tool. Saga tool further adds the elevation based on the slope parameter provided.
9.5 Flow direction
The saga tool produces Flow direction raster which we can show as arrows. The steps are explained below.
Install Crayfish plugin.
- Plugins \(\Rightarrow\) Manage and Install plugins
- Search Crayfish and install
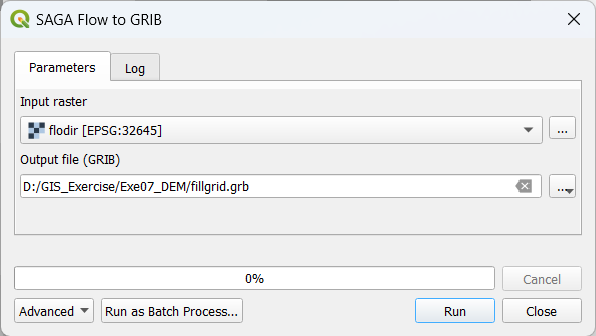
Open Crayfish \(\Rightarrow\) Conversions \(\Rightarrow\) SAGA Flow to Grib tool from Processing Toolbox
Fill the parameters as below
Add the newly created mesh file (fillgrid.grb) to the project using Add Mesh Layer tool.
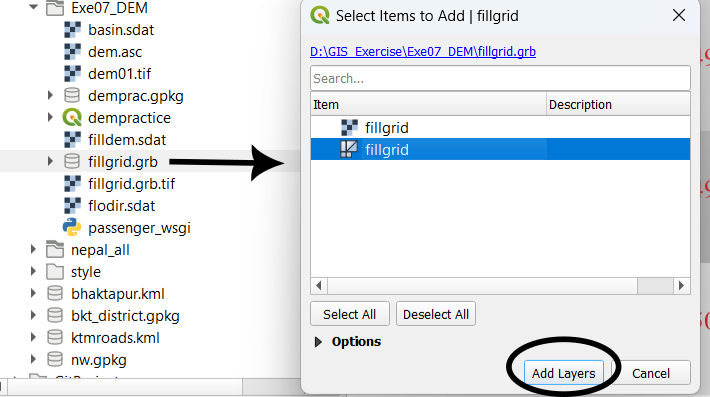
Flow Mesh -> Add Now double click the flowgrid mesh to show the symbol.

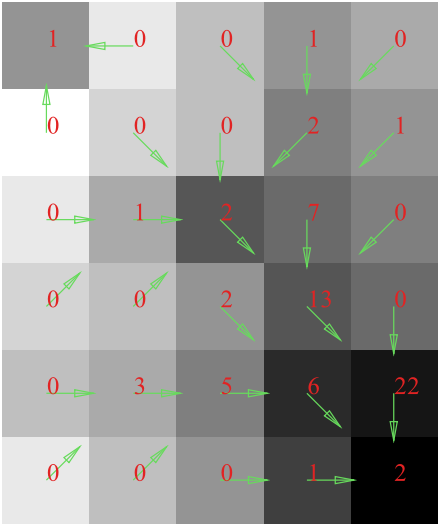
Finally the flow direction will be shown as below.
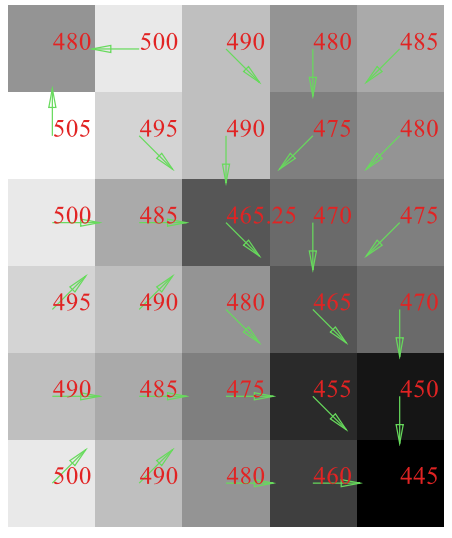
Flow Direction Flow Accumulation
Find r.flow tool in Processing Toolbox
Fill the parameters as shown below

Flow Accumulation Tool
Now we can see the flow accumulation values by converting flow-accumulation raster to vector.
Flow Accumulation Result