1 Introduction
1.1 This Book
This book will introduce the concepts of GIS(Geographic Information System) through practical applications using QGIS.
Structure and instructions used in this book will become clear as we go through it.
1.2 Installation of QGIS
This book uses QGIS installed for Windows 10. You may encounter some minor differences than explained in this book if your OS is different. QGIS can be installed in various ways. In this book I will recommend to install QGIS standalone version from the website: http://qgis.org. This book uses QGIS version 2.18. You can use newer version. In that case there may be some differences in the interface explained in this book.
Download the software from the above website. You will need to check whether your OS is 64-bit or 32-bit. In case of any confusion you can download and install 32-bit version.
1.3 QGIS Interface
QGIS interface consists mainly of followings:
Menu bar with menus
Panels which can be moved, removed, docked and undocked
Tool bars with tools
Map display area where a map is displayed
Status bar which has various information

Figure 1.1: QGIS interface
Other items of the interface being the same as any standard software, special mention and explanation is needed for the panels. Fig.1.2 shows Layers panel, you can find maximize and close buttons as well as related tools within a panel.

Figure 1.2: Layers panel
In the figure, Layers panel is docked together with Browser panel as you can see in the figure. These two panels can be switched by selecting the tabs at the bottom. When you select Browser panel, the interface will change as shown in figure 1.3.

Figure 1.3: Browser Panel

Figure 1.4: Show Hide Panel
1.4 Understanding QGIS interface through exercise
Before starting the exercises, let us create a folder for keeping our data. Make a new folder named GIS_exercise in any convenient location. For our exercises in this chapter, we will create folder Exercise01 for keeping data. We need GIS data to show in QGIS. We will learn what is GIS data in next chapters. Before that, let us practice an exercise which will show map of world in QGIS. Many GIS data are available for download from websites. For this exercise, we will download data of world boundary from website http://www.naturalearthdata.com/downloads/50m-cultural-vectors/50m-admin-0-countries-2/. Click on the button Download Countries. Save and extract your zip file in GIS_exercise\Exercise01. You can use 7-zip or any unzip program to unzip the data.
1.4.1 Example: Visualizing GIS data in QGIS
Start QGIS Desktop from windows start menu.
Add GIS data.
You can add GIS data in different ways as follows. For this exercise practice all the three methods.
Click Menu Layer \(\Rightarrow\) Add Layer \(\Rightarrow\) Add Vector Layer
In the popup window click browse and point to the folder where you extracted the data. See the Figure 1.5.
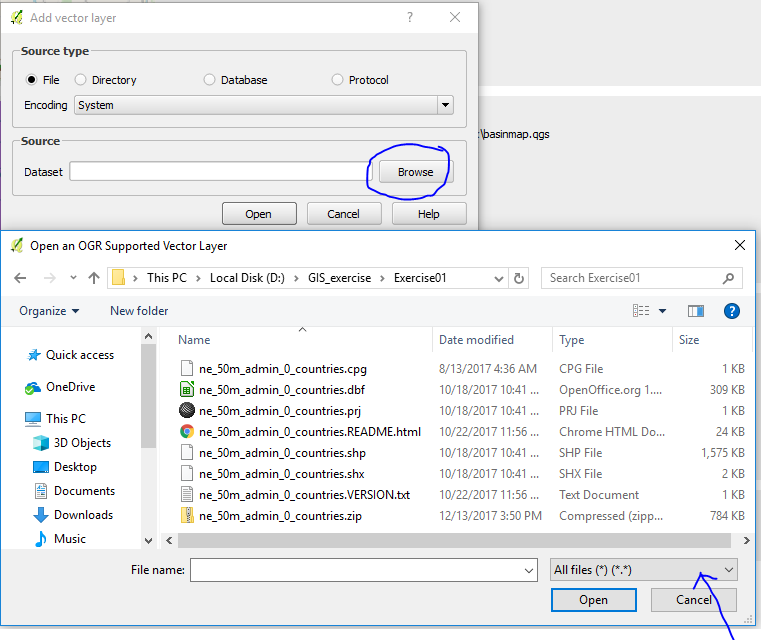
Figure 1.5: Add vector layer
Note : If **All Files** is selected in the filter, change it to **ESRI shapefile** so that you can see fewer files in the list.Select the file ne_50m_admin_0_countries.shp and click Open (in the file selection window), again click open in add vector layer window. You will see the map of the world added to the display area.
Click on the Add Vector Layer tools under Manage Layers tool bar as shown in the Figure 1.6.
You will get the same popup window as in the above step(Figure 1.5. Follow the steps as shown in above method.
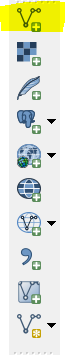
Figure 1.6: Add vector layer (from manage layers toolbar)
Activate browser panel.
Expand folder(click + sign on the left) to show the location of data as shown in the Figure 1.7.
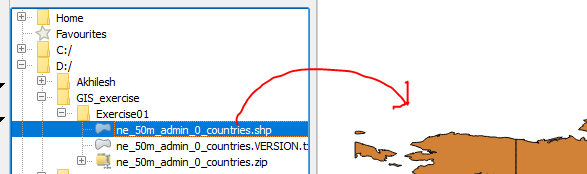
Figure 1.7: Add vector layer (using browser panel)
Drag and drop the file to map display
Note: You may be tempted to Undo (by clicking Ctrl+Z or by selecting Undo from Edit menu) to remove some of the layers added by above action, but it will not work. In this example we have displayed a map of world countries.
Let me explain how to remove the layers you have added in the next section. Don’t close the QGIS window. You may save the project as ex01.qgs inside GIS_exercise folder.
1.5 Elements of QGIS interface
In this section, I would like to explain about some of the tools, menus and panels necessary for basic maneuver of QGIS.
1.5.1 Layers panel
Layers panel and Browser panel are two important panels for basic working with QGIS.
First of all, let us try to understand Layers panel Figure 1.8.
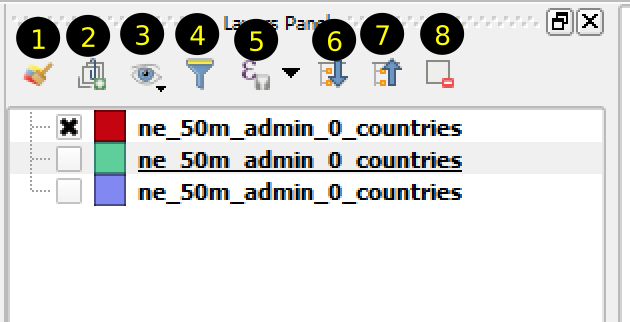
Figure 1.8: Layers panel
If you have completed the above exercise, your Layers Panel will look like Figure 1.8. Inside the Layers panel, you will see all the layers you have added to the map. There are 8 tools as shown in the same figure. Each layer in the list of layers have three components: 1) check box for showing/hiding the layer, 2)Symbol of the layer and 3) name of the layer. Some properties of the layer shown in the list of layers is enumerated below, try to learn by practicing.
- When a layer is clicked, it becomes selected and the background changes to blue.
- If you click on the check box on the left, it will toggle between hide and show. When the check box is checked, the layer is visible on the map. Try to show and hide each layer.
- When you right click a layer, you will get a context menu. We will illustrate some of the context menu items in this chapter through exercise. Some of the items will be introduced in the upcoming chapters.
- Double clicking a layer will show its properties.
- Now let us look at some of the tools marked 1 to 8 in Figure 1.8. Details of each tool shall be explained through exercises.
- Open the layer styling dock: This tool can be used to change the style of the layer.
- Add group: This tool will add a group. This tool helps managing layers in group.
- Manage layer visibility: This tool will show or hide multiple layers in the Layers Panel. You can try clicking on the tool and the subsequent menu items.
- Filter legend by map content: This tool will be explained later.
- Filter legend by expression: This tool will be explained later.
- Expand all: This tool will expand the layers inside a group.
- Collapse all: When you select a group in the layers panel and click Collapse all tool, the layers within the group will be hidden. It is opposite of Expand all tool.
- Remove layer or group: Select a layer in the layers panel and click on this tool and see what happens.
1.5.2 Browser panel
Now we will see the contents of Browser panel.
QGIS can display GIS data from different sources. Browser panel is handy tool for selecting and displaying GIS data from different sources. QGIS 2.18 is able to handle GIS-data from following sources as shown in Figure 1.9. - GIS data from your hard drive - GIS data from various Spatial Databases - GIS data from various spatial data servers
You will find Project Home, Home, Favourites, and drive names within the Browser panel which will assist you in selecting GIS data from your hard drive. In QGIS, you can save a map file after adding various layers. This file is called project file. Project Home will show the data inside the folder where your project file resides. Similarly, Home is the location of user’s home folder such as C:/Users/Akhilesh in Windows.
QGIS supports DB2, MSSQL, Oracle, PostGIS and Spatialite database.
QGIS supports Mapserver, Feature server and Tile Server such as ArcGisMap-Server, WMS, WFS etc. Some of the capabilities will be demonstrated in coming chapters.

Figure 1.9: Browser panel
1.5.3 Menus/Tools
Many of the QGIS capabilities can be accessed through Menus and tools of QGIS. Some of the tools and menus will be explained in the next example.
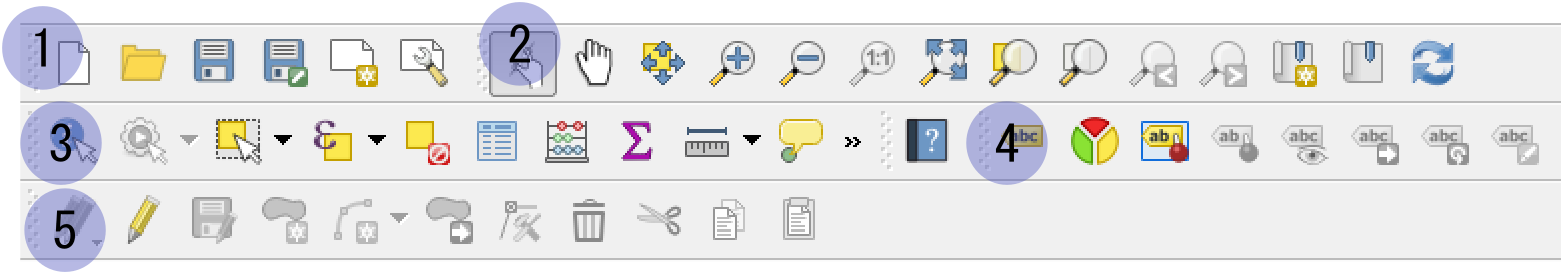
Figure 1.10: QGIS Tools
As shown in Figure 1.10 and marked from 1 to 5, let us look at the functions of some of the toolbars.
- Project toolbar: You can create a new project, open an existing project, save an opened project with the tools in this toolbar. You can also create or open a canvas for printing. The same function can be accomplished by using sub menus of Menu \(\Rightarrow\) File.
- Map Navigation toolbar: You can zoom and pan the map with these tools. You can also zoom to a selected feature (What is feature? \(\Rightarrow\) see the next chapter). Many of the capabilities of this toolbar can also be accomplished by using sub menus of Menu \(\Rightarrow\) View.
- Attribute toolbar: The tools contained in this toolbar can be used to identify the features of different layers of map(identify tool). You can also select a feature of the map (Selection tool). Using Attribute tool, you can show attributes of a layer. You can also measure length, area or angle using Measure tool.
- Label toolbar: It is used to label the features of the map.
- Digitizing toolbar: It is used to edit the features of a layer.
1.5.4 Status Bar
Status Bar is located at the bottom of the user interface. You can find coordinates, scale, coordinate reference system and few other items in the status bar as shown in @(refStatusBar).
- Coordinate: This shows the coordinates of the cursor as you move your mouse.
- Scale: Scale shows the scale of the map. You can also directly enter the scale to change the zoom level of map.
- Coordinate Reference System (CRS): You can see a globe mark with EPSG followed by some number. It shows the coordinate reference system in terms of EPSG code. Coordinate Reference System is explained in detail in section .

Figure 1.11: Status Bar
1.5.5 Using menus and tools of QGIS.
- You can continue from the last example, if you have not closed the QGIS session. If you have more than one layers in the layer panel, you can remove layer(s) by any of the following methods.
- Right click on a layer to be removed in the Layers Panel and choose Remove in the context menu. (You can also select multiple layers using Shift Key)
- Select a layer(or multiple layers) in the Layers panel and click on Remove layer or group tool in the Layers Panel.
- Now you have only one layer in the map. Let us use some map navigation tools and attribute tools.
- Click Zoom In tool (with + sign) on the map navigation toolbar. Draw a rectangle on the map as shown in 1.12. The map of the selected area will be displayed.
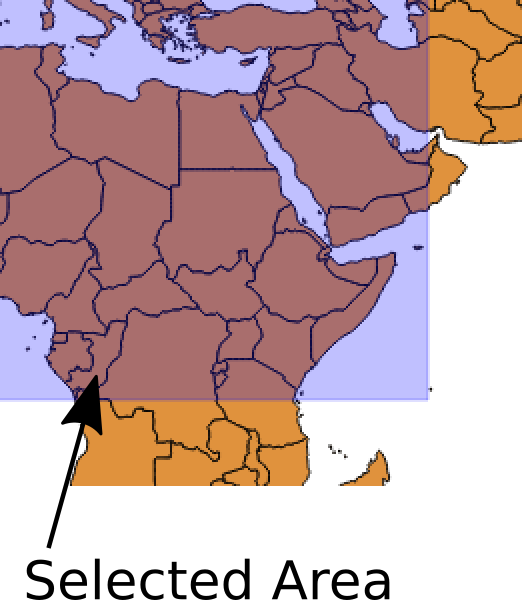
Figure 1.12: Using zoom in tool
- Click Zoom Out tool (with - sign) and draw a rectangle on the map and see what happens.
- Click Zoom Last tool and observe what happens. You will see that the area displayed just before using Zoom Out tool will be displayed. You can click on this tool as many times you like. When there is no history remaining for the last displayed area, the tool will be grayed out (disabled). Now you can click Zoom Next tool and see that display area will change in the forward direction. These tools are similar to the back and forward arrow in the web browser.
- Click Identify Features tool on the Attribute toolbar. Click any country on the world map.
You will see Identify Results panel displayed somewhere(probably on the right side) in the user interface. You will see the attributes of the feature displayed in tabular form as shown in Figure 1.13.
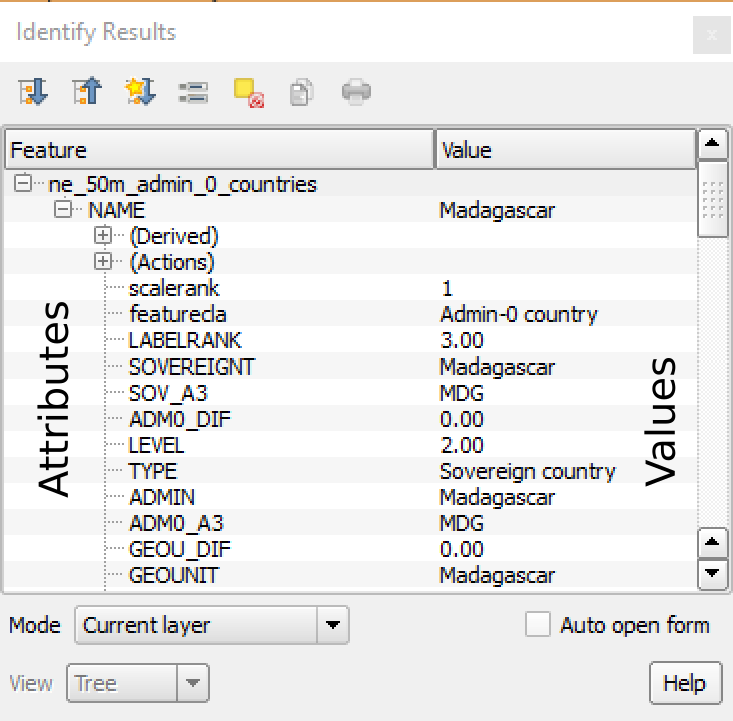
Figure 1.13: Identify Results
- Now click Select Features tool. Move (hover) the cursor on each tool and you will see the name of that tool as tooltip info. You can select single country by clicking it or you can select multiple countries by drawing a rectangle.
- Now click Zoom to Selected feature in the Map Navigation toolbar. The map display will zoom to the selected feature(s).
- Now click Open Attribute Table in the Attribute Toolbar. You will see a table as shown in Figure 1.14.

Figure 1.14: Attribute Table
- What is attribute table?
Attribute table is related to GIS data. We will explain in detail later about the types of GIS data. However, let me explain in short about the GIS data we have displayed. It is clear from the map that the GIS data represents the geometric boundary of all countries in the world. But the GIS data does not only contain the geometry but also the properties of each geometry in terms of numbers and texts. These are called attributes or fields. Each geometric feature represent a country. The attribute table shows each attribute as column for each features represented by rows of the table. More rows and columns can be seen by moving the horizontal and vertical scrollbars.
Now let us try the followings and observe what happens.
- Try to guess the meaning of each attribute.
- Click on any column header (attribute name), for example . The table is sorted in the order of country name.
- Click on any row header. The background of the row becomes blue and the corresponding feature is shown in yellow color in the map. This means the feature is selected. If you can not see the feature, you can click on Zoom To Selection tool.
- Next we will use some of the tools in Label toolbar, namely: Layer Labeling Options tool and Layer Diagram Options tool. Follow the steps below.
- Click Layer Labeling Options tool. You will see a dialog box as shown in Figure 1.15.
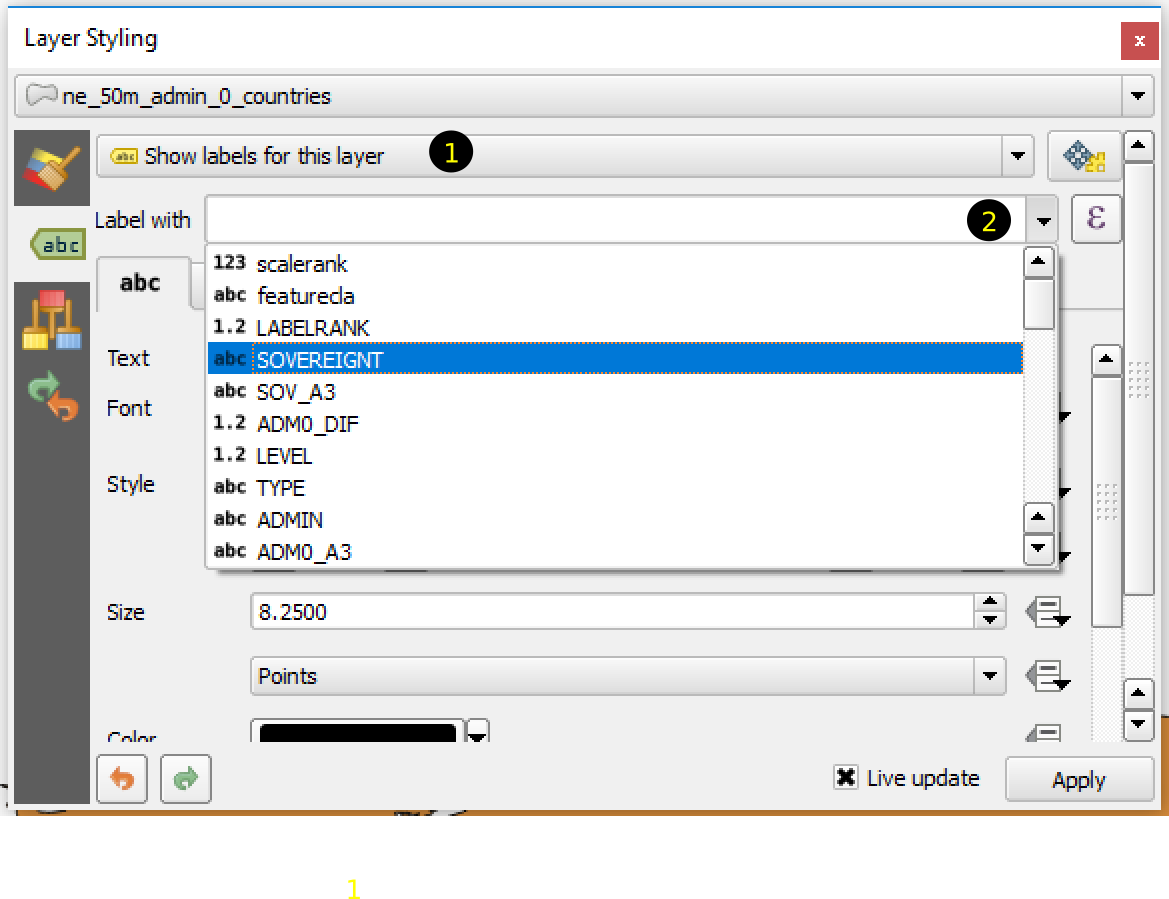
Figure 1.15: Labeling the features
- Change No Label to Show labels for this layer
In the Label with Selection box, select SOVEREIGNT. Click Apply button at bottom right corner and close the dialog box.
You can find many other options to beautify the labels on the features.Now let us try to use Layer Diagram Options tool. You can see it beside Layer Labeling Options tool.
Figure 1.16 shows the steps to show Label as diagram.
- Step-1: Click the tool Layer Diagram Options. On the left pane of the dialog box, change No diagram \(Rightarrow\) Pie Chart.
- Step-2: Select Attributes from the list on the left pane. Select Attribute \(``POP_EST"\) and click on the plus(+) sign.
- Step-3: Select Size from the list on the left pane. Select Scaled Size radio on the right pane. In the Attribute selection box, select POP_EST. Click Find button to fill the Maximum Value field. In the Size input box, write 6. Check the Increase size of small diagrams and set the value to 0.2.
Step-4: Click OK at the bottom of the dialog box.

Figure 1.16: Using Label Diagram tool