Abstract
Synthetic Aperture Radar(SAR) provides very useful data. Especially during low visibility, use of SAR data is among few options to analyse the land surface characteristics. However, complexity behind the theory of SAR, difficulty in processing and unavailability of high resolution SAR data has restricted the use of SAR to professionals only. However, since the launch of Sentinel-1 satellite in 2014 and free provision of high resolution SAR data has got wide audience. Further, ESA (European Space Agency) has been developing and freely distributing software such as NEXT, S1tbx, SNAP for processing of remote sensing data which has made SAR analysis very easy.
Background of present analysis is the flood inundation in Terai area due to incessant rainfall during 2nd week of August 2017 as reported by various publications.Kantipurpost has published several photographs of the flooded area. Some of the photographs can be found here (http://kathmandupost.ekantipur.com/news/2017-08-11/flood-hit-saptari-in-pictures.html).
It is necessary for the administrators and students working in the field of Disaster Risk Management to understand various ways of obtaining the extent of the disaster. This article is an attempt to encourage the students to learn the remote sensing analysis using self-help tutorials and to make use of vast amount of freely available data.
Present analysis was done for my personal interest in the disaster risk management. I hope, professionals will be further interested to explore the field of remote sensing, especially the opportunity provided by the availability of high resolution data free of cost.
2 Introduction
2.1 Sentinel Satellite data
Sentinel provides the highest resolution data available without any cost. Sentinel-1 provides SAR data while Sentinel-2 provides the data in optical spectrum (visible, thermal and infra-red bands) composed of more than 10 bands of data.
2.2 Some features of SAR data and its properties
As the name suggests, Sentinel-1 records the reflection of radar (microwave sensor) wave emitted by the sensor mounted to the satellite. Unlike the Sentinel-2, it has active sensor. The visible range of optical sensor data can be viewed by applying appropriate colors to the corresponing band of data. It makes easy to delineate the land-use visually or by analyzing the optical bands using raster-calculators. However, during rainy season, the image taken by optical sensors are covered with cloud which limits the analysis of flood. SAR using microwave sensors which can penetrate through clouds which makes it highly suitable for the analysis of flood and its extent as it can observe the earth during rain and during day or night time. In general, the return signals of SAR are influenced by the view angle of the sensor, the material of the reflecting objects and the surface roughness as well as the frequency and polarization (Gstaiger et al., 2012; Townsend & Walsh 1998). As the The raster data captured by SAR consists of the phase and amplitude data which is in complex data format. It needs to be multilooked to properly view on the computer screen.
Multilooked image in GRD format can be downloaded from https://scihub.copernicus.eu/ as explained in the above pdf document.
2.3 Terai flood 2017
Incessant rainfall during the second week of August 2017 created havoc in the Terai area of Nepal as well as the adjoining areas of India. Following are some of the findings of the report titled Post Flood Recovery Needs Assessment (https://www.npc.gov.np/images/category/PFRNA_Report_Final.pdf).
Heaviest rainfall in over 60 years recorded in some of the districts
Almost all of the Terai districts were severly affected by the flood
About 190 thousands of houses were destroyed or partially damaged
Death: 134 numbers, affected population 1.7 million
3 Methodology
I started this study few months back. I would like to mention that while I was writing this article, similar article appeared in the Coordinates magazine which can be accessed at http://mycoordinates.org/sentinel-1-sar-data-based-flood-mapping-and-monitoring-of-river-kosi-bihar-india/.
Therefore, I would not elaborate all the process of the analysis used in this study.
Following are the data downloaded for the purpose of this study.
Sentinel-2 data
At the time of flood (25 August, 2017)
After the flood subsidence (14 December, 2017)
Sentinel-1 data (Synthetic Apperture Radar Data)
At the time of flood (11 August, 2017)
During normal time (26 January, 2018)
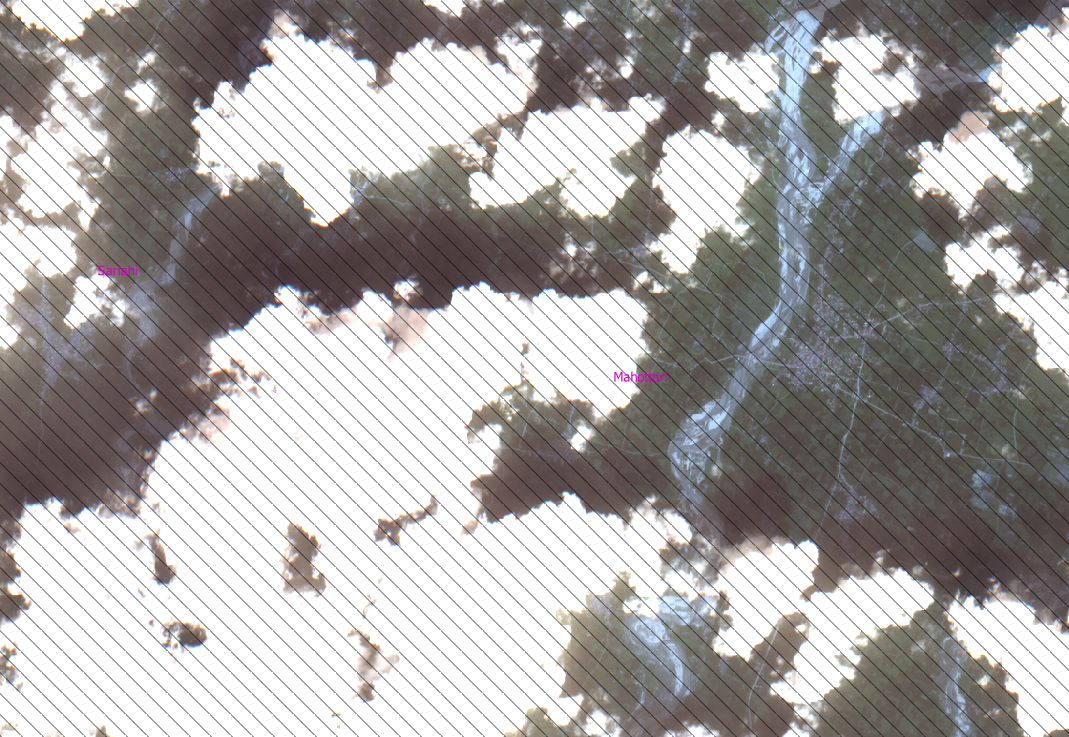
The Sentinel-2 data is not available for the time of flood. From the daily news magazine reports and other sources, it seems that the flood in the Terai was at peak around 11th11th to 14th14th of August. However, even after about 10 days of the flood, the optical (Sentinel-2) data shows wide area of cloud coverage.
Sentinel-1 data was processed using SNAP, a software developed and freely distributed by European Satellite Agency (ESA).
3.1 Study Area
Before starting of the study I didn't have any specific area in my mind. As the reports suggested that almost whole of the Terai plain of Nepal was flooded during the season, I just caught hold of an area which was captured in one single image of Sentinel-1. The area is shown in 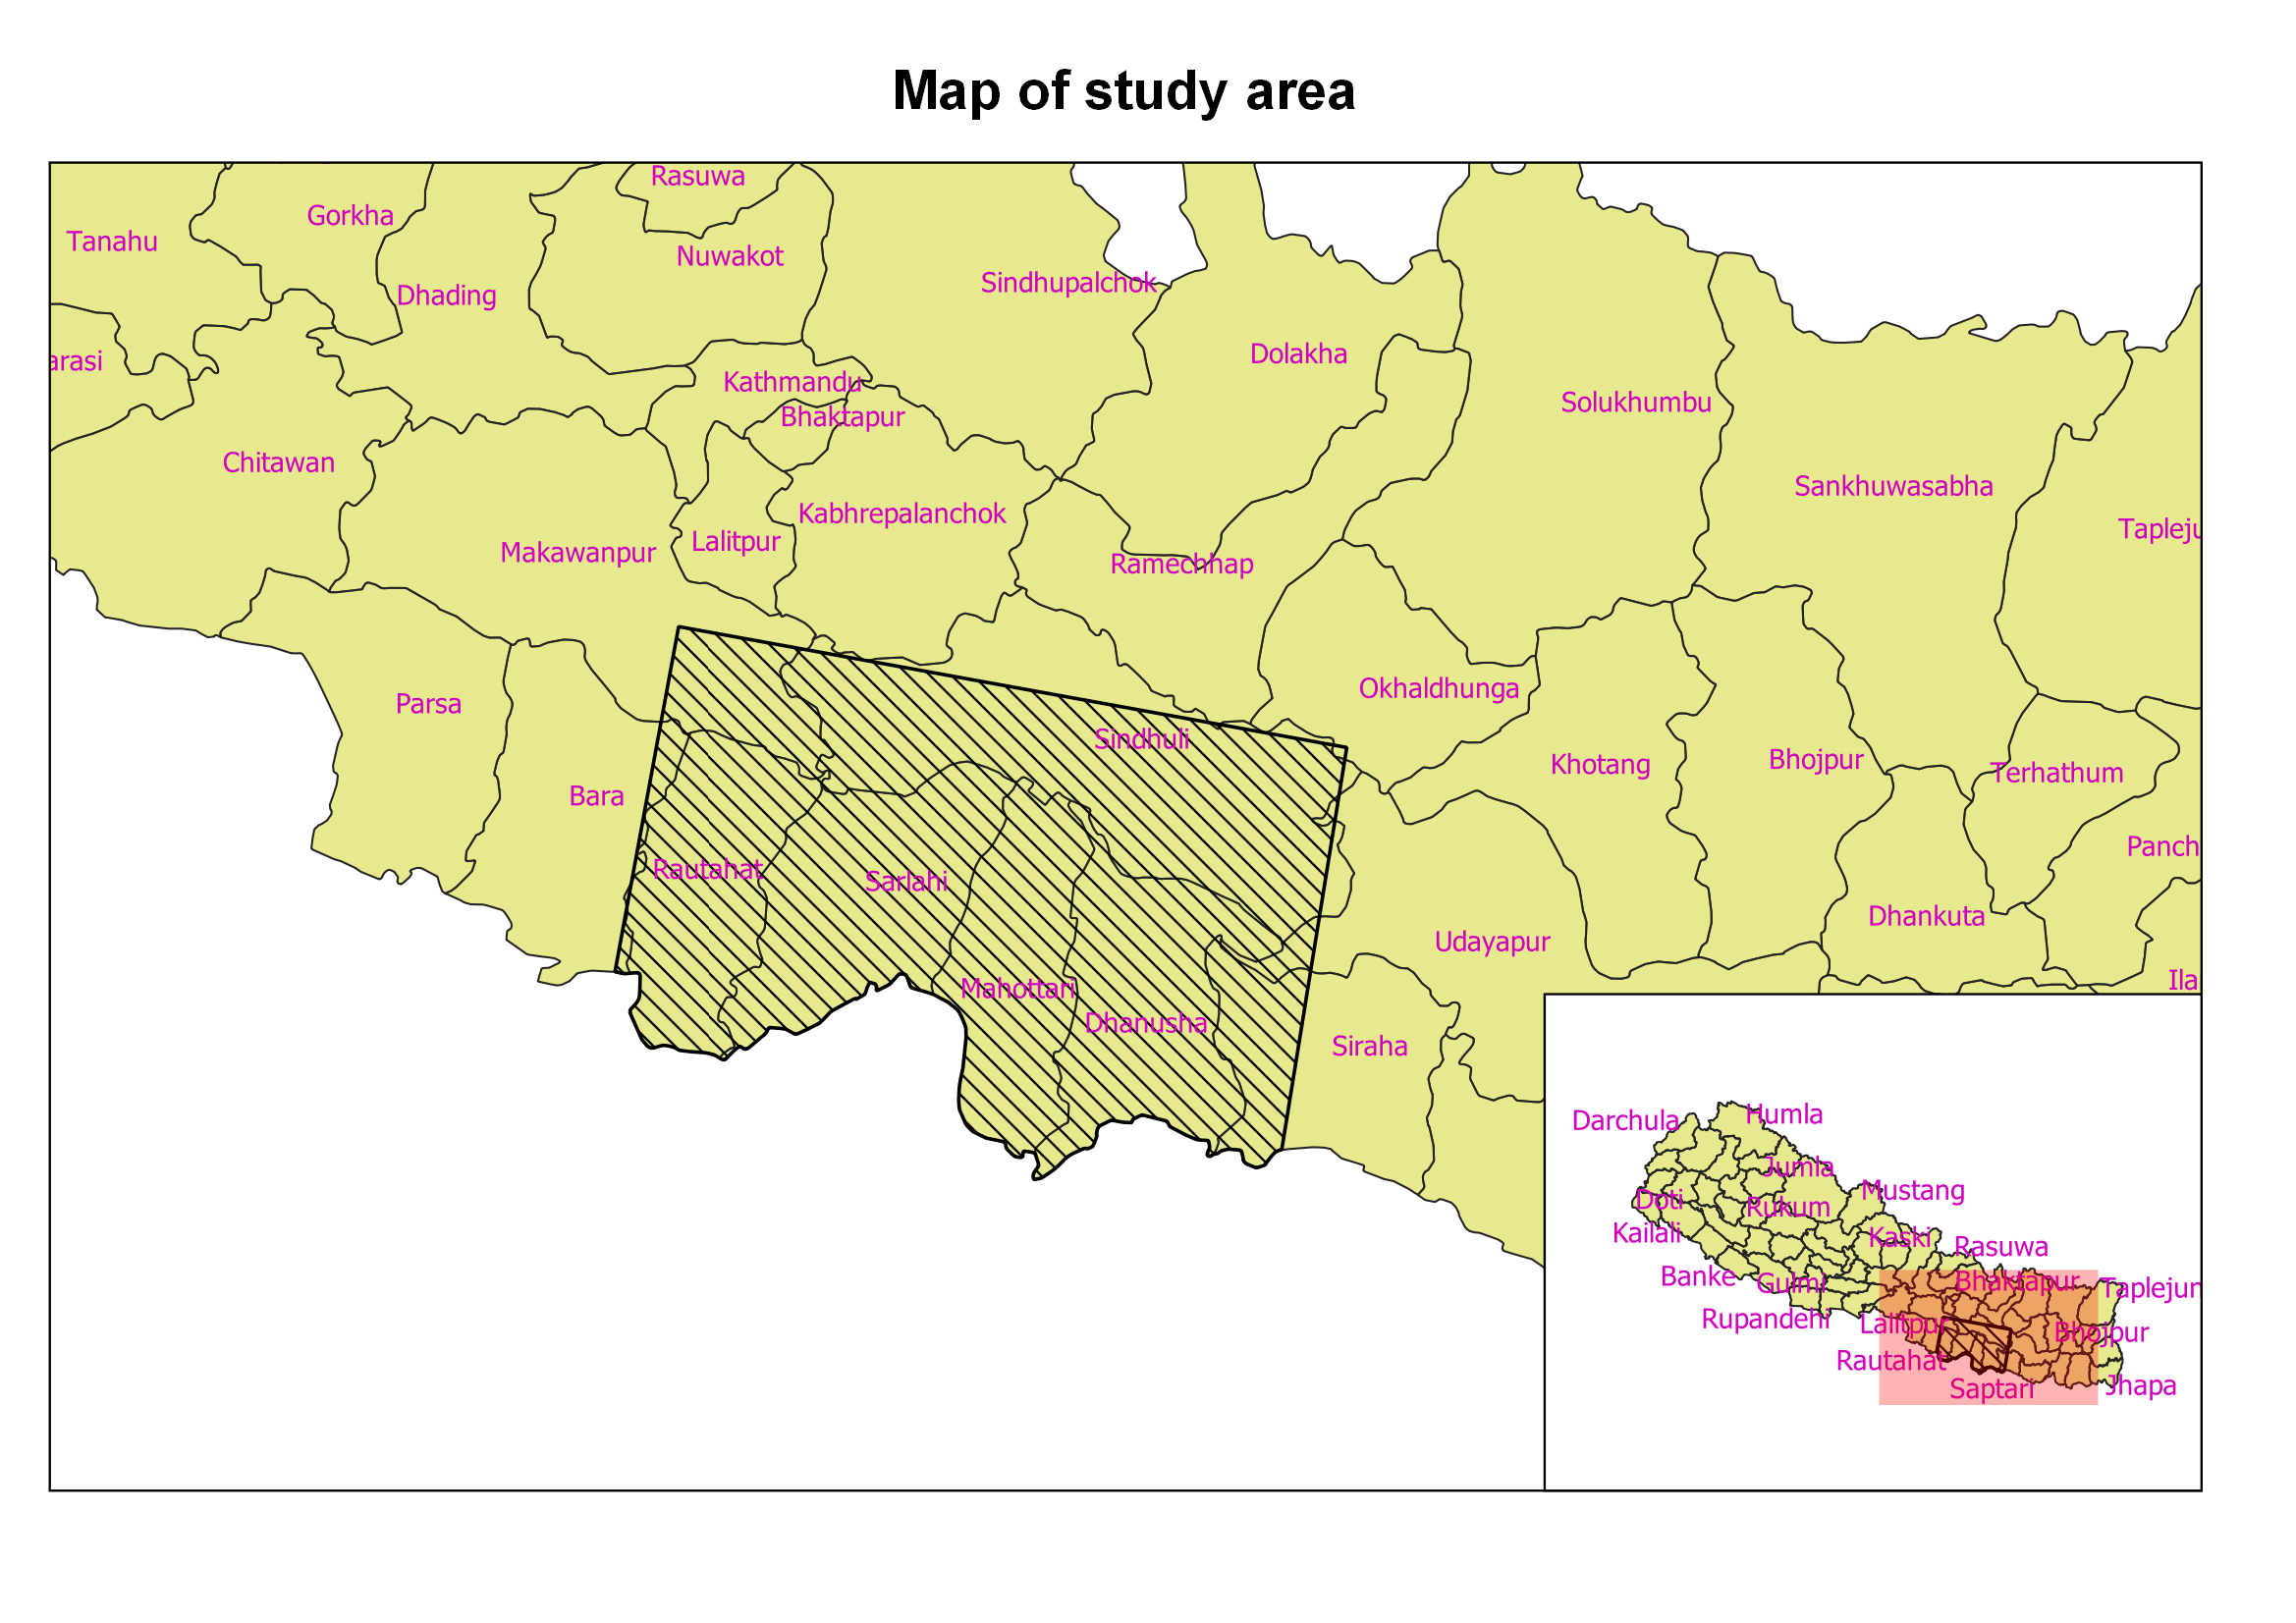
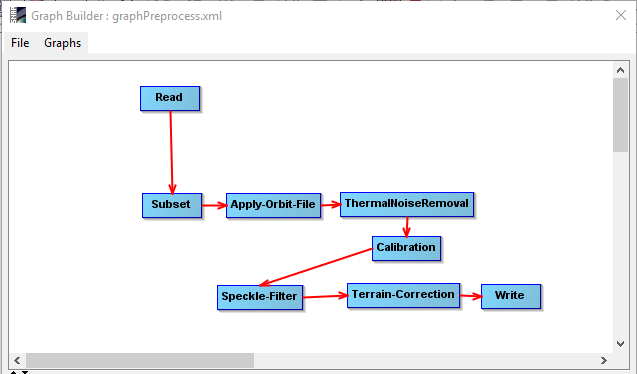
3.2 Preprocessing of SAR data
Ground Range detected product downloaded from the website, when opened in GIS it looks stretched in one direction and the geometry is not correct. The image also consists of speckle noise. Therefore, all the Sentinel-1 products were applied preprocessing in SNAP software as follows (It is easy to batch process remote sensing data in SNAP using graph builder):
3.3 Images used in the study
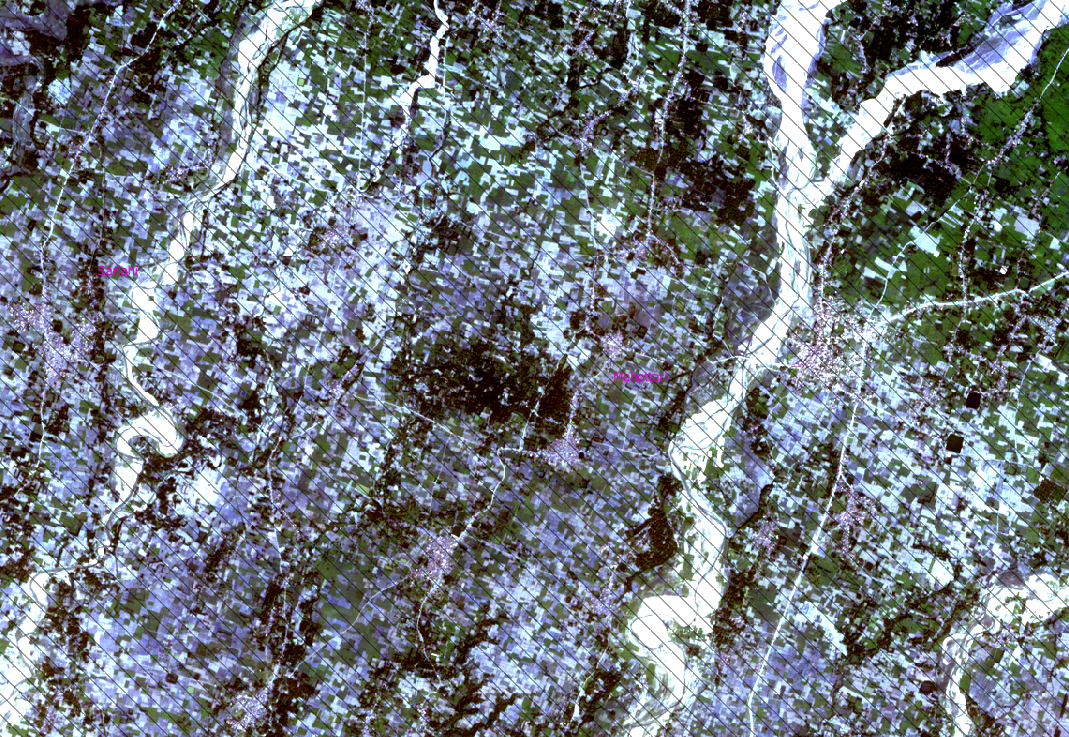
3.3.1 RGB image (Sentinel-2) of a part of the study area (during normal time)
3.3.2 RGB image (Sentinel-2) of a part of the study area (during monsoon)
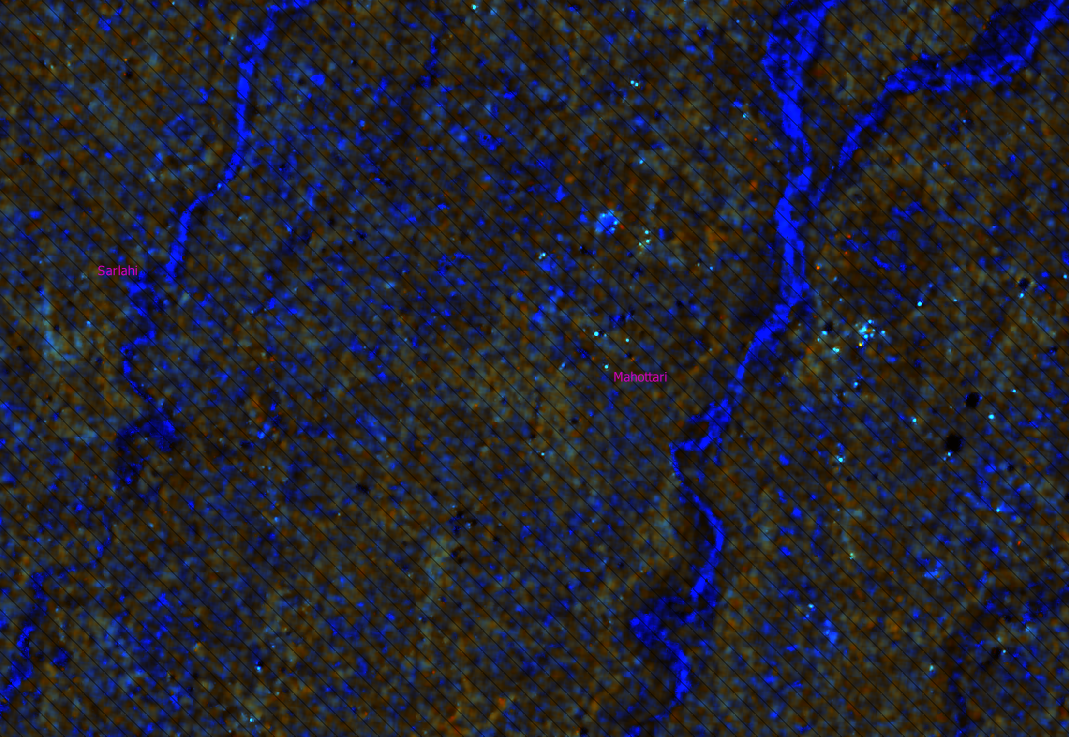
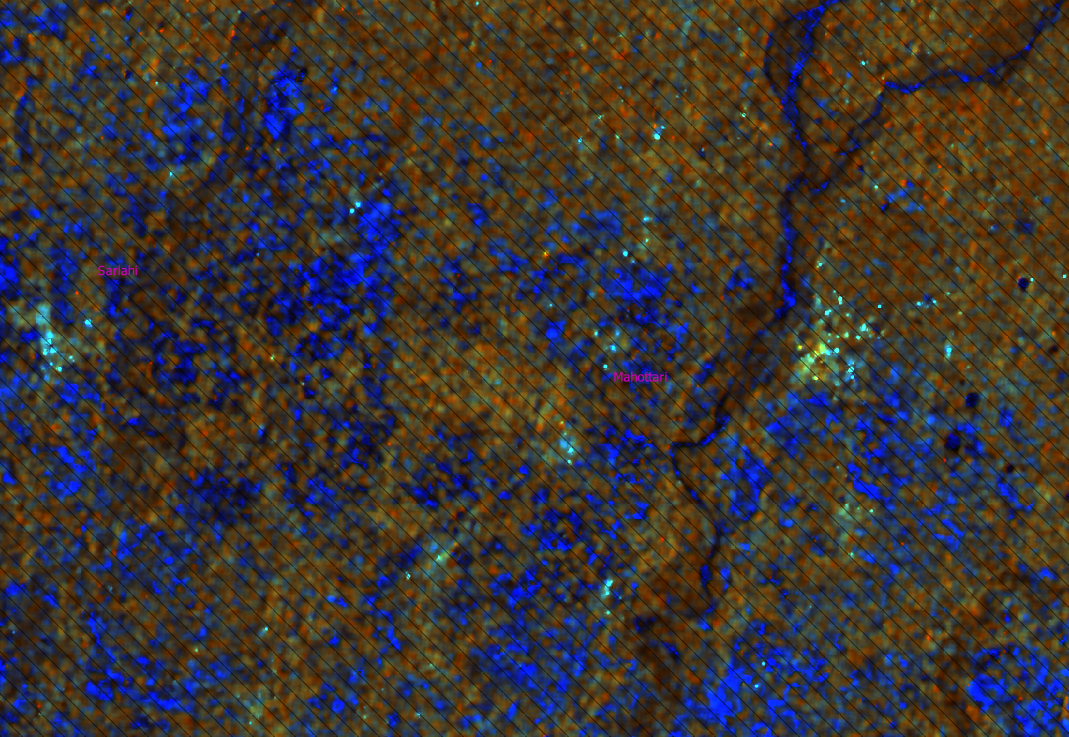
3.3.3 Sentinel-1 SAR data after preprocessing
The following image shows the same part of study area as above using the VV, VH and VV/VH as red, green and blue channels, where VV and VH represent the polarizations of the SAR data.
3.3.3.1 Normal time (January 2018)
3.3.3.2 Flooding (August 13, 2017)
3.4 Analysis of SAR data
SAR data obtaind during flooding (13 August, 2017) was classified in SNAP into 8 classes using unsupervised classification. The classes were matched against the RGB image. The result of study is presented in the next section.
4 Result and analysis
4.1 Output of SAR visualization
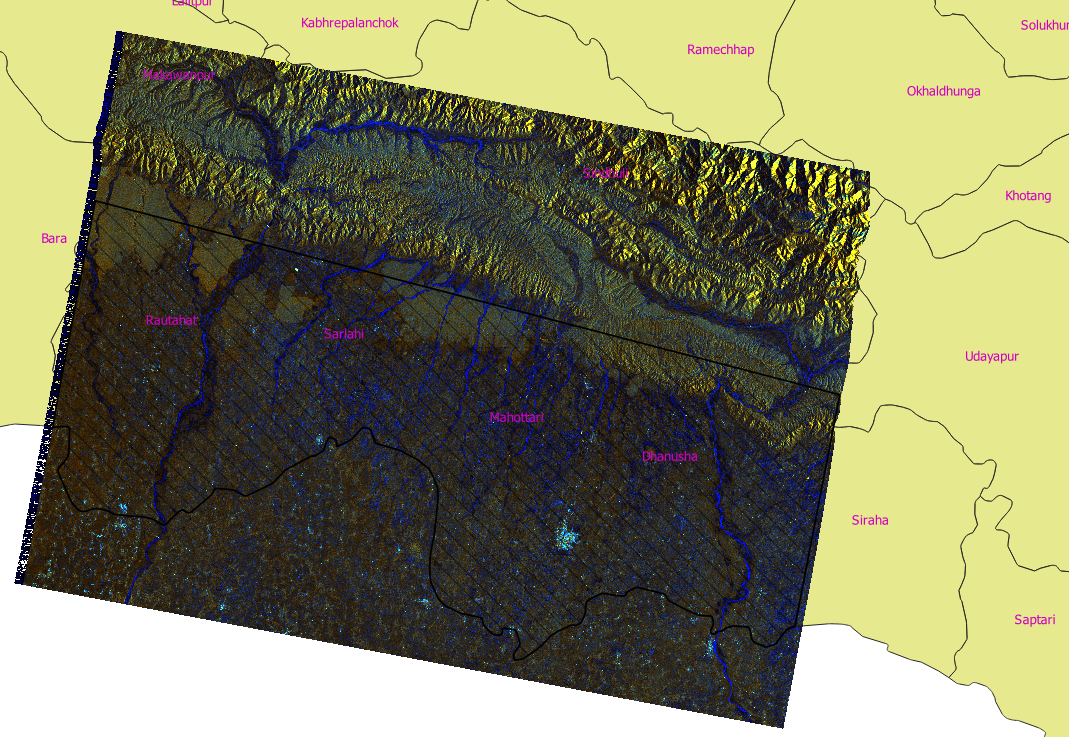
4.1.1 Representation of SAR data as RGB: During normal time
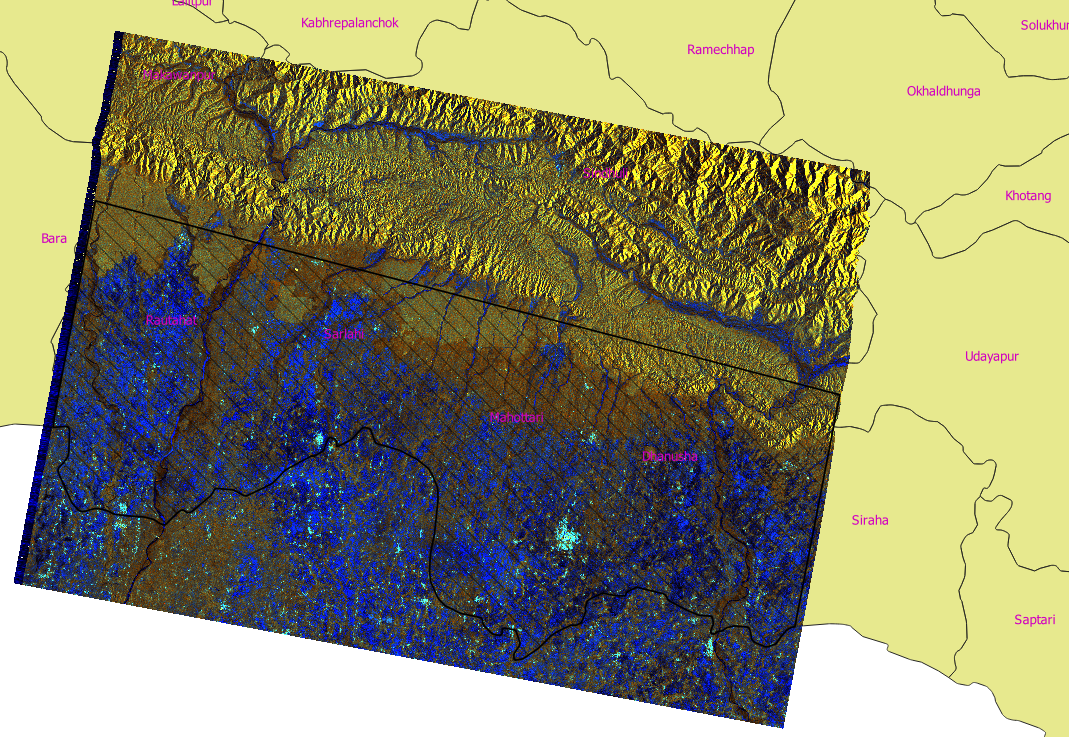
4.1.2 Representation of SAR data as RGB:Flooding (August 13, 2017)
4.2 Analysis
As we can see from the above figures, we can see that there is clearly bigger area of blue pixels in the image of August 2017 as compared to the normal time. We can assume that the pixels represented in blue color are either flooded or irrigated.
Further, the SAR image of the August 2017 was classified into 8 classes using unsupervised k-means classification method. Classes were matched with the corresponding RGB image. The following figure shows the classified image. The image was exported as kmz and viewed on google earth.
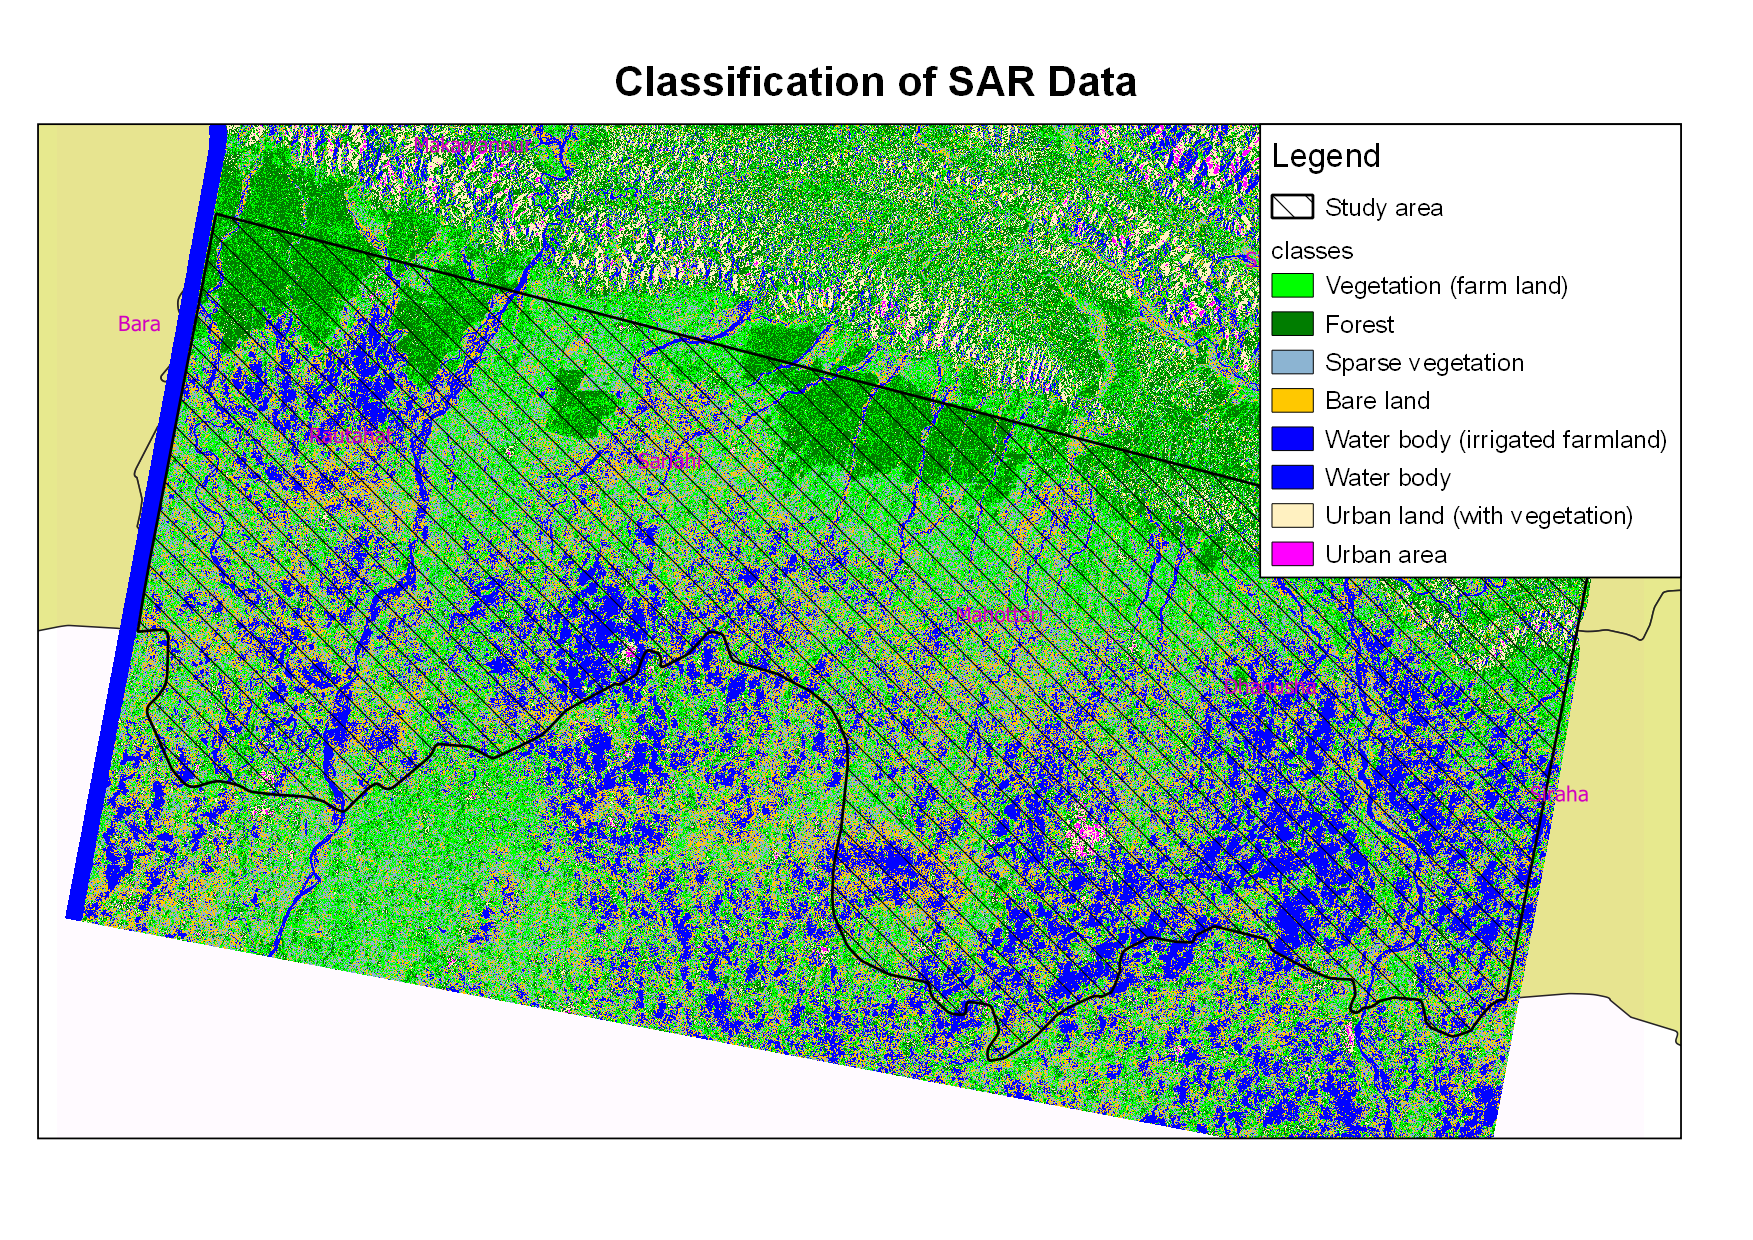
Some points to note:
Most of the classified image matches well with the Google earth.
Some of the urban area are classified as vegetated or forested area, which may be falsely classified.
It may be necessary to further differentiate between the back-scatter from the urban buildings and forested area which may exhibit the similar properties.
Further analysis is possible to clarify the landuse more precisely.
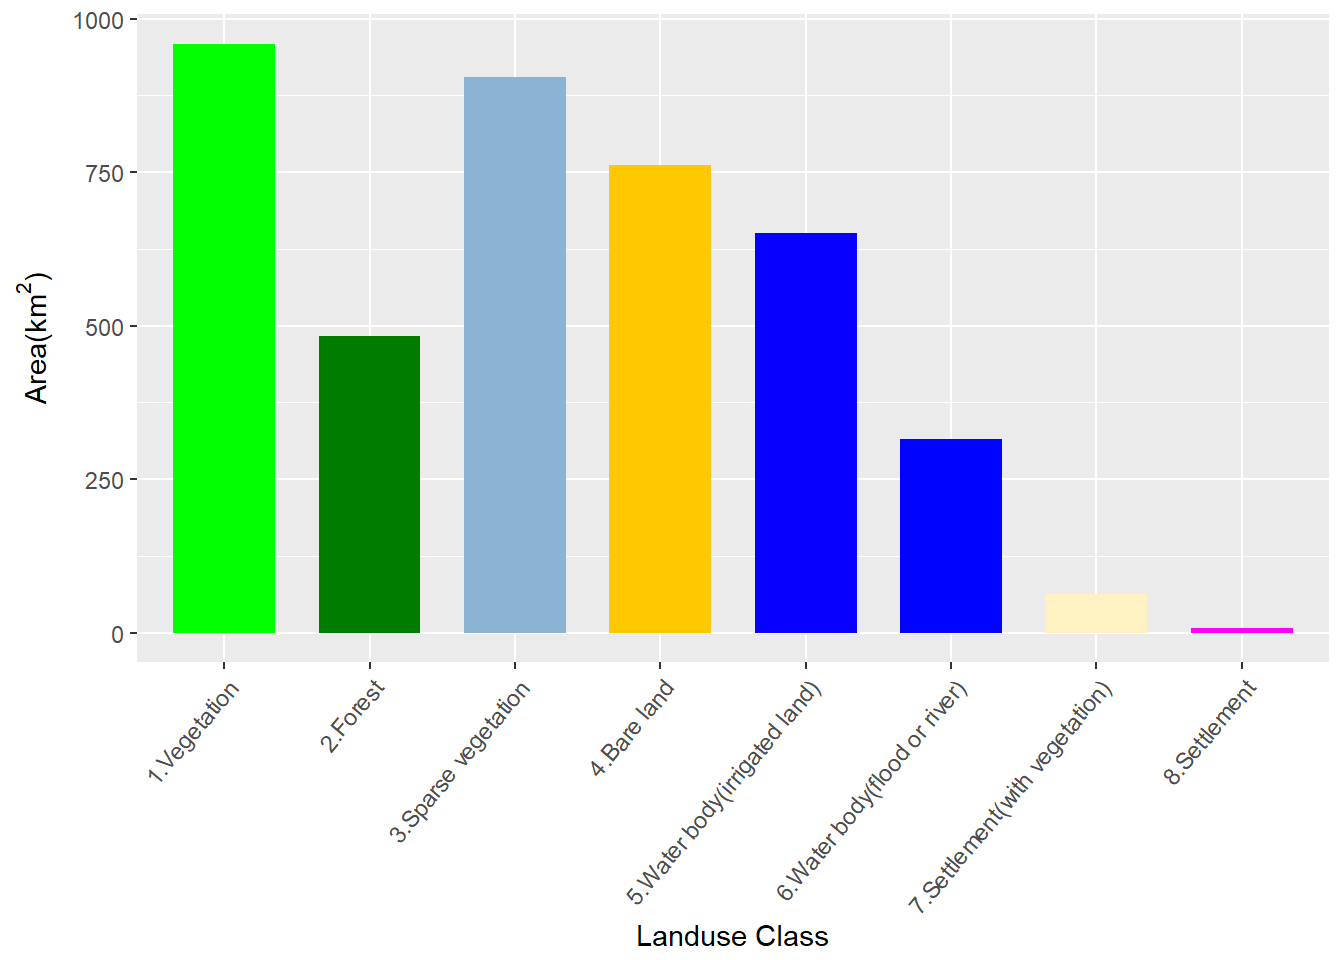
The area of each land use class as per the analysis is plotted which is shown below. According to the figure, around 315km2315km2 which is about 7%7% of the total area (4147km24147km2).
5 Conclusion
Present study shows the capability of Sentinel SAR data to analyze the flooding in Terai plane of Nepal. Same process can be used to analyze the flooding in whole the Terai area during August 2017 flood. Present study is not exhaustive and there is possibility of improvement. However, it may open further avenue to efficient use of Sentinel SAR data and more students become professional user of such data using freely available data and freely available software.