1 Abstract
This tutorial is intended to learn how to calculate the dam storage area and volume based on the dam height. It uses GRASS-GIS to find the storage area. The tutorial starts with introduction to basics of GRASS GIS and then importing the GIS data and finally creating the dam storage area.
2 Preparation of Data
In this tutorial, it is assumed that the learners already know how to prepare elevation data. If you don’t know, please go through the relevant tutorials. For this article I have used merged-clipped DEM data obtained from ASTER-DEM which is available freely.
Note that we already have DEM data in GeoTiff format.
3 Create Location data from DEM
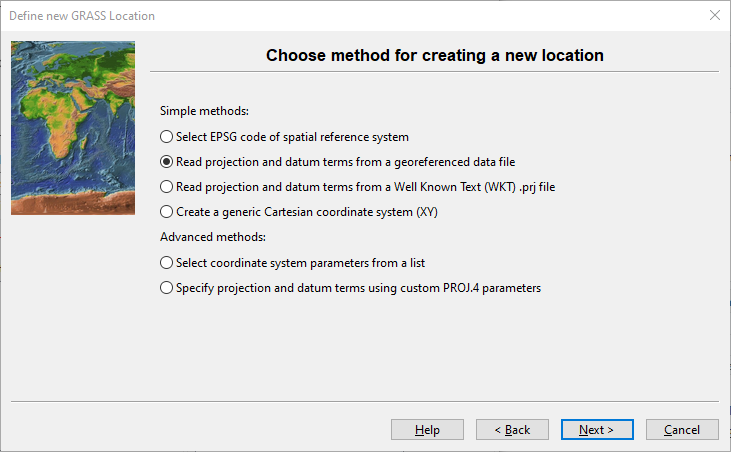
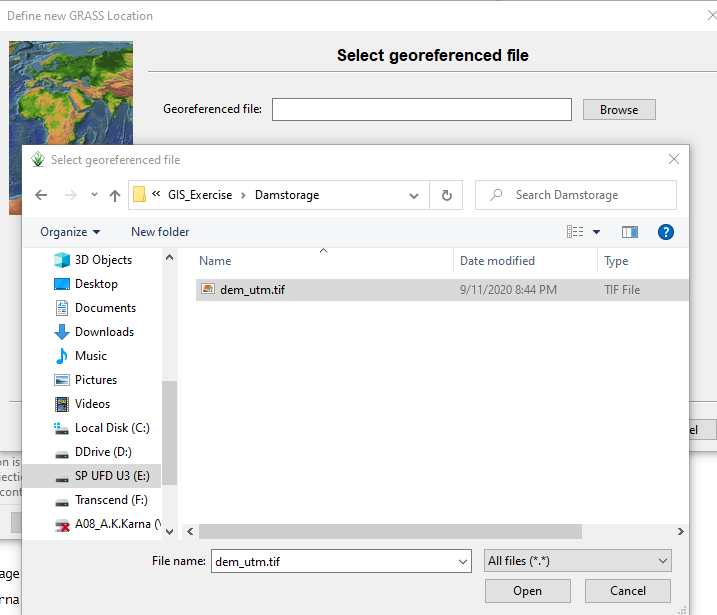
Open GRASS GIS and create new location as shown below.
- Select Folder and add title etc.
 2. Select the Coordinate Reference System (CRS)
In the next dialog box, click Finish button. Click OK in the next dialog.
Click Yes when a dialog box for importing the selected data is displayed.Completion of data import may take a few seconds. After the import is completed, click Start Grass Session in the main display of Grass-GIS.
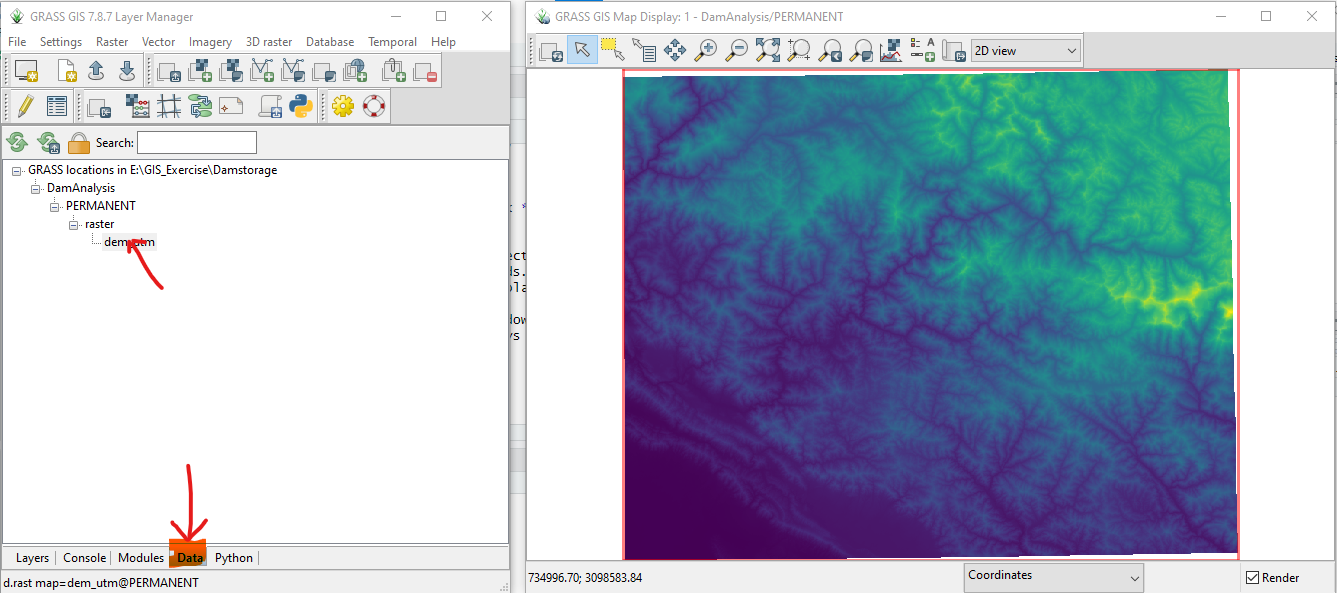
Two windows of Grass will be displayed. The first (main) window consists of different tools for the analysis of GIS data. Second(map) window displays the map.
Open Data tab in the main window and double click the DEM data as shown below.
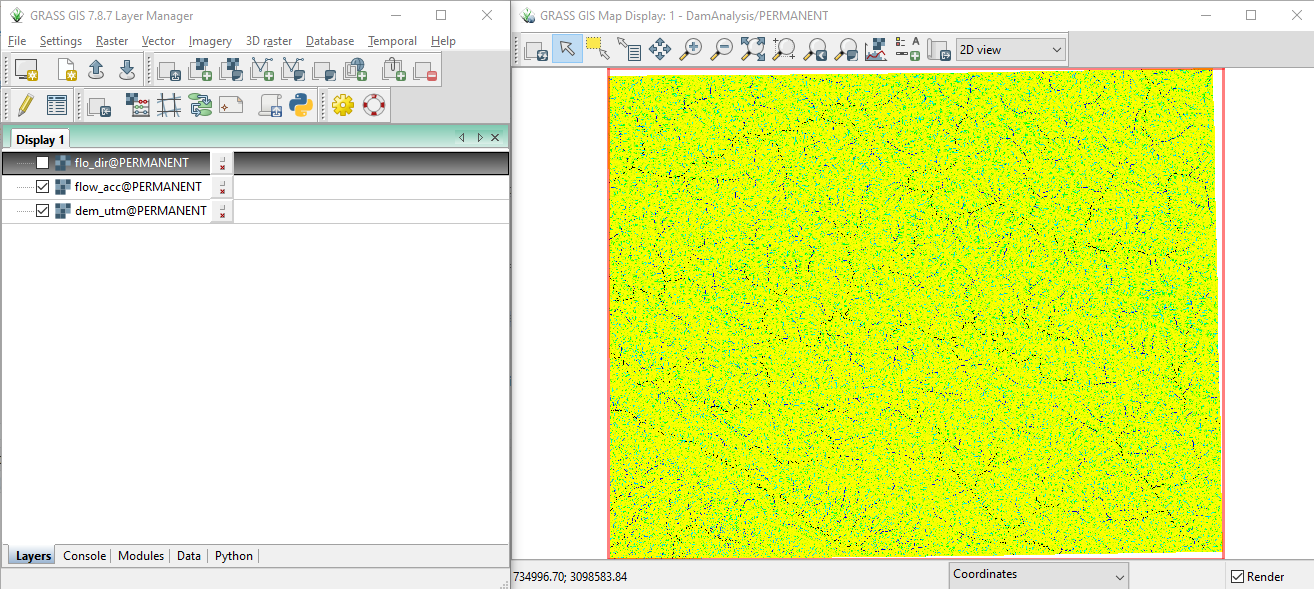
4 Create Flow Accumulation data from the DEM.
- Open Console tab and write the following command.Change the name of elevation data according to the name of your data. Press Enter after writing the command.
r.watershed -sa elevation=dem_utm accumulation=flow_acc drainage=flo_dir
The above command will create flow accumulation and flow direction rasters. You can manage showing and hiding GIS data using Layer Tab.
5 Contour
To find the proper dam location it is necessary to visualize the elevation data. Contouring is the best way to visualize elevation. Follow the steps below.
- Using tiff file of DEM, create contour using QGIS. Contouring can be done in Grass-GIS too. But I found it too slow.
- Import contour vector data to Grass-GIS using v.import and selecting the vector data as input.
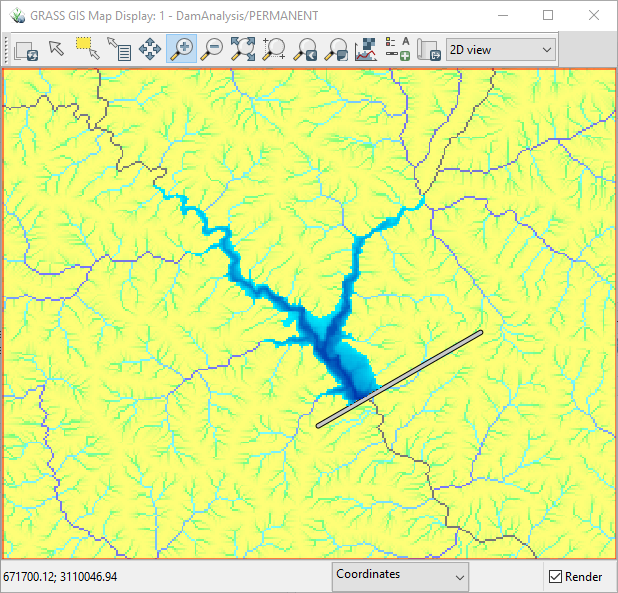
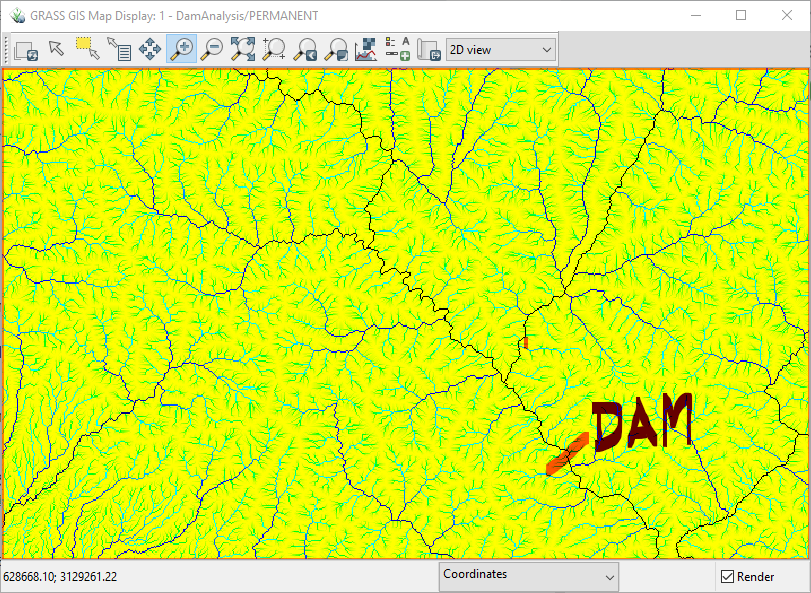
6 Create Dam
Let us select an area to create a dam. Flow accumulation raster shows the drainage pattern. We will draw vector line data to represent a dam.
- Zoom to a river and select a proper location for dam.
- Create Vector Line data for the dam
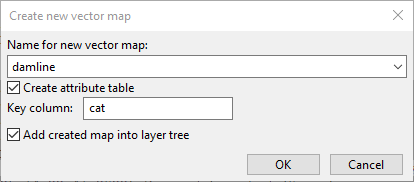
- Select name of vector line data
Digitize dam as line data
- Select vector layer(damline) in the layers tab
- Click pencil mark (edit) layer
- Click digitize new line tool
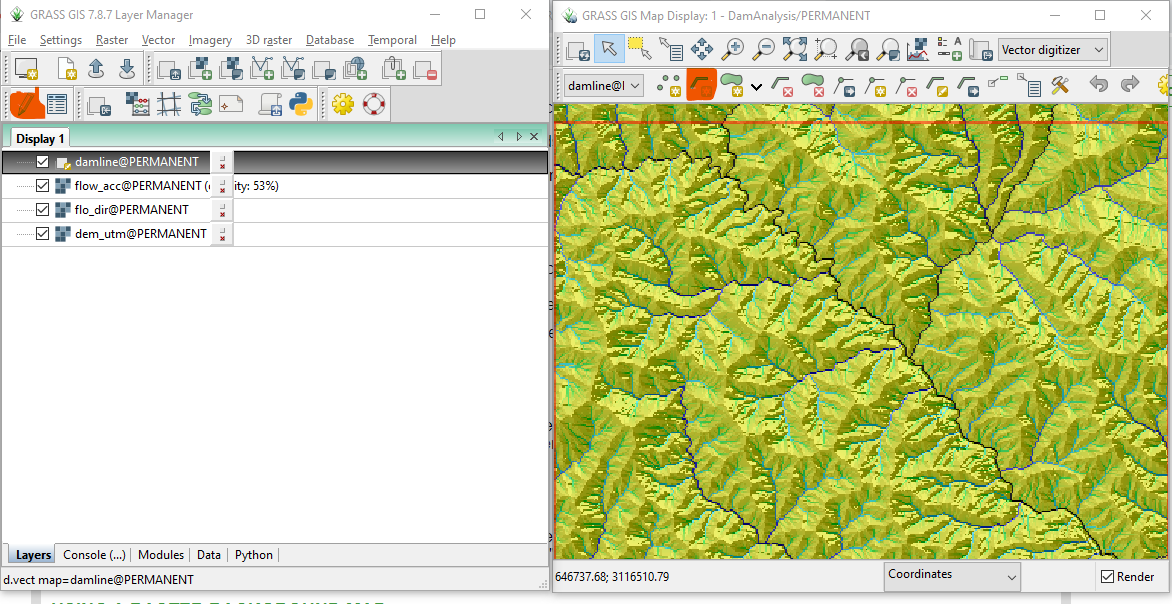
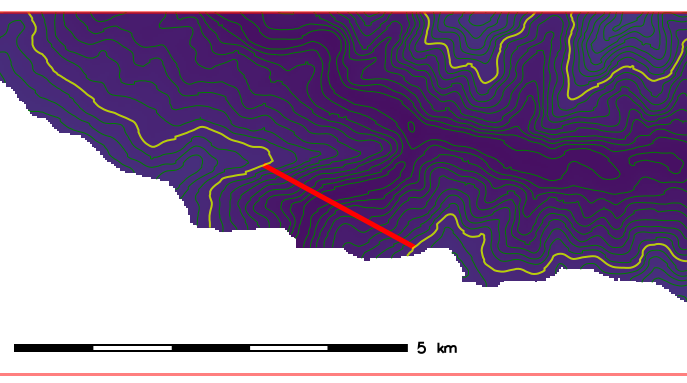
- Draw line (represent the dam) joining the points of the same contour line. In the following example, 850m contour line is selected.
After completion of editing, double click.
Add column elevation and put the value=1, run following lines of code one by one.
v.db.addcolumn map=damline@PERMANENT columns="elev int"
v.db.update damline col=elev value=1
6.1 Create buffer (to make a polygon) using damline vector data
v.build map=damline@PERMANENT
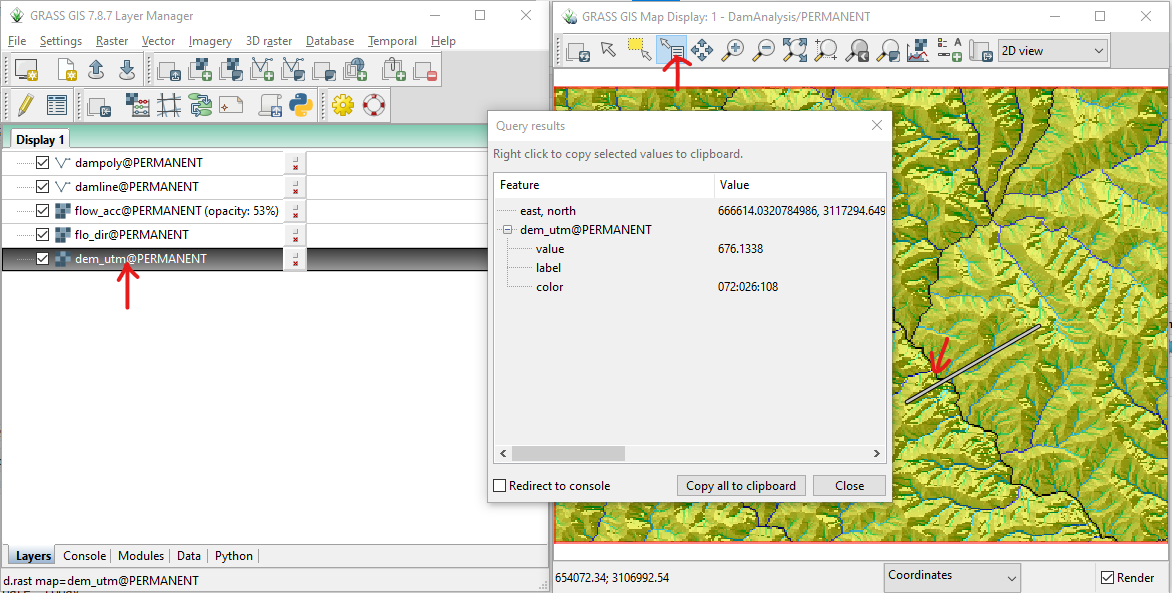
v.buffer -t input=damline@PERMANENT output=dampoly distance=1006.2 Find the altitude just above the dam
- Select dem layer in the layer console
- Click the query tool in the map display window
- Click the location above dam
- As shown in the figure the elevation is 676m.
6.3 Convert buffered polygon to raster using following code
v.to.rast input=dampoly@PERMANENT output=dam.p1 use=val6.4 Find the storage area and volume
- Set the dam height well above the ground elevation (e.g. 1500) so that the water does not overflow.See the code below.The following code creates the raster (dam.w2) same as the elevation raster except the dam area which will have a value of 1500.
r.mapcalc expression="dam.w2 = if(isnull(dam.p1), dem_utm, 1500)" --overwrite- Find the coordinates of DEM above dam polygon by right-clicking
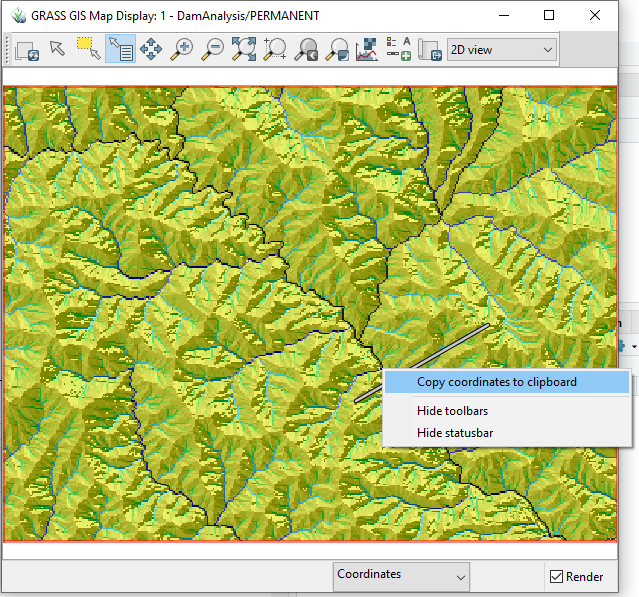
- Fill the point with water level = 800 (for example). Change the x-y coordinates accordingly.
r.lake elevation=dam.w2@PERMANENT water_level=800 lake=dam.f coordinates=666842.4616903653,3117099.7358401124 --overwriteThe output (Console tab of main window) is like below.
- Lake area 16437164.727258 square meters
- Lake volume 970926553.462708 cubic meters
The map display for the storage area is shown below. Using above map we can create water elevation-volume graph and animate the change in storage area with elevation.